
Fig. 4.
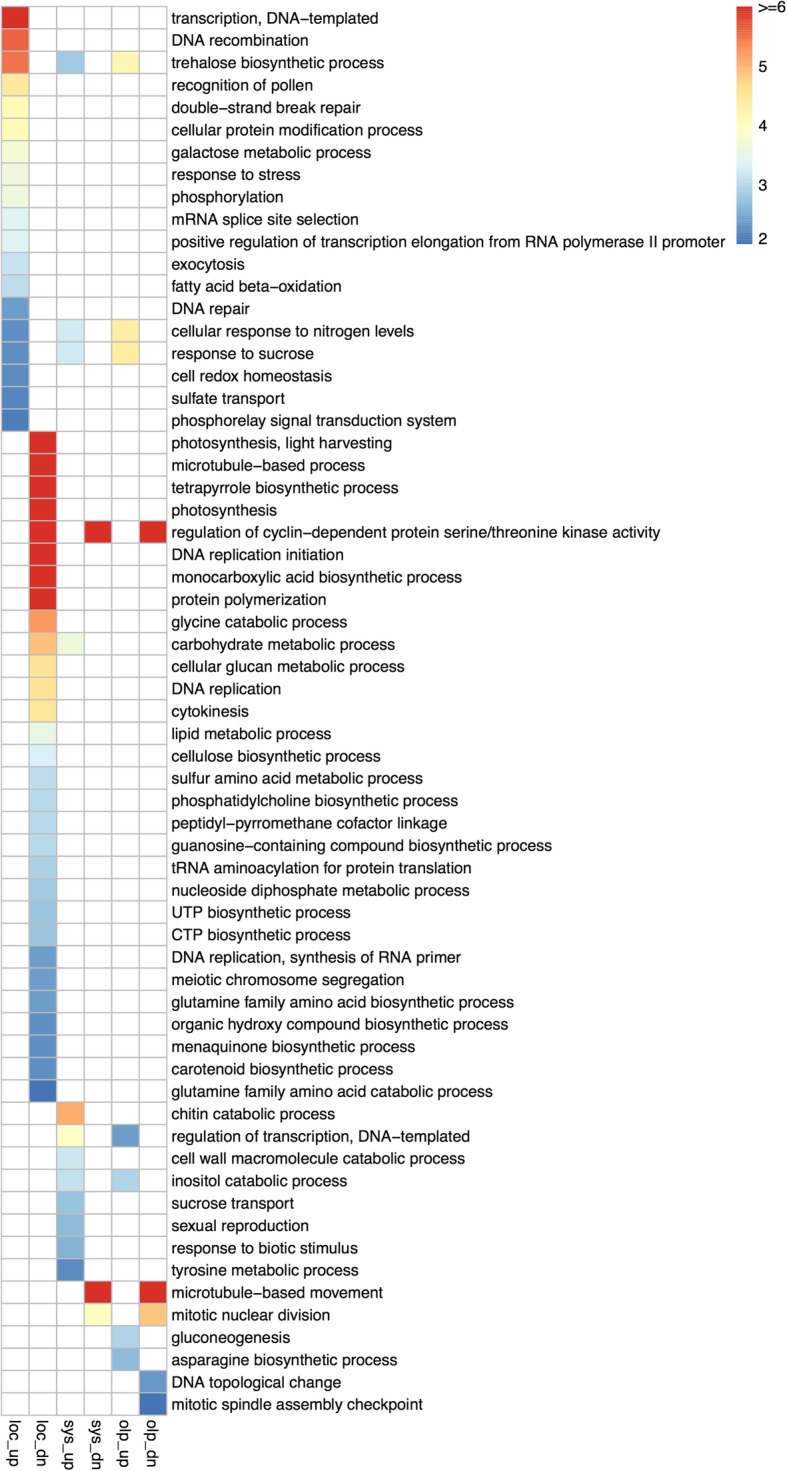
Functional enrichment analysis of differentially expressed genes in local and systemic TYLCV infections. Heatmap shows the Gene Ontology terms of biological processes that are significantly enriched (p < 0.01) in the up−/down-regulated genes in the local infection, the systemic infection, and their overlaps. Each square is colored according to the value of –log10(p), where p is the p-value for the significance of GO term enrichment. The color bar indicates the –log10(p). loc: local infection; sys: systemic infection; olp: overlapping between local and systemic infections. up: up-regulated; dn: down-regulated