. 2019 May 14;10(26):6448–6456. doi: 10.1039/c9sc01590f

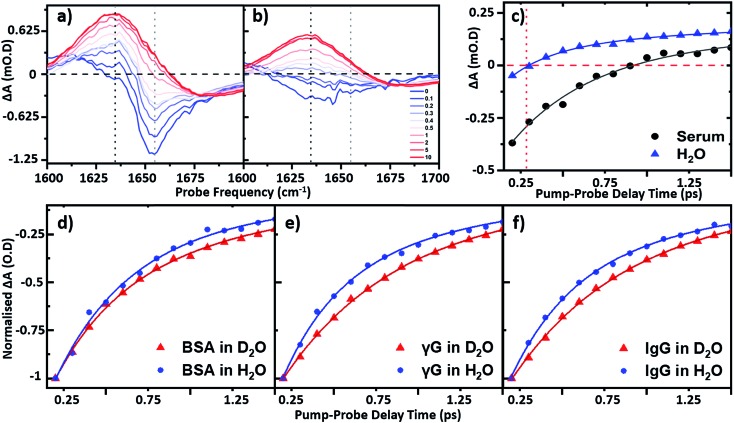
Fig. 4. IR pump–probe spectra of (a) serum albumin and (b) H2O. Waiting times range from 0 ps (blue) to 10 ps (red). (c) Temporal variation of the bleach signal observed in the IR pump–probe spectrum of H2O (blue) and serum (black) at a frequency of 1650 cm–1. Solid lines show fits to the data using a single exponential function with a decay time constant of 220 fs (H2O) and 0.83 ps (serum) respectively. Temporal variation of the amide I v = 0–1 bleach signal for (d) serum albumin (e) γ-globulins and (f) IgG in both D2O (red) and H2O (blue) solvents. All pump probe data were obtained with magic angle polarization of pump and probe pulses.

Fig. 4