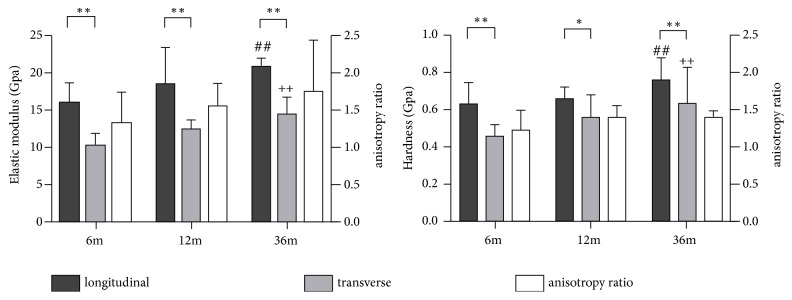
Figure 5.
The distributions of mechanical properties in the central region. ∗∗p < 0.01 when compared to transverse results in the same age group; ∗p < 0.05 when compared to transverse results in the same age group; ##p < 0.05 when compared to longitudinal results in 6-month and 12-month group; ++p < 0.05 when compared to transverse results in 6-month and 12-month group.

