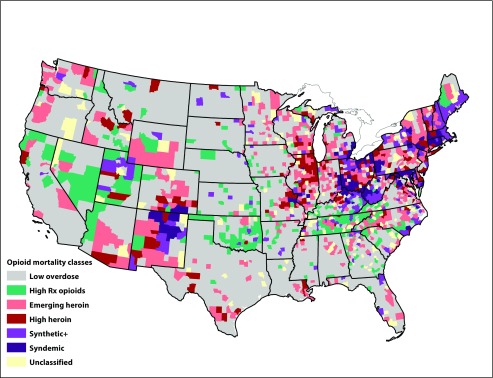
FIGURE 1—
The Geographic Distribution of Opioid Mortality Classes by County: United States
Note. Classes are derived from absolute mortality rates in 2014–2016 and the change in rates between 2002–2004 and 2014–2016. Counties in the synthetic+ class have above average and fast-growing mortality rates from synthetic opioids alone or in combination with prescription opioids and, to a lesser extent, heroin.

