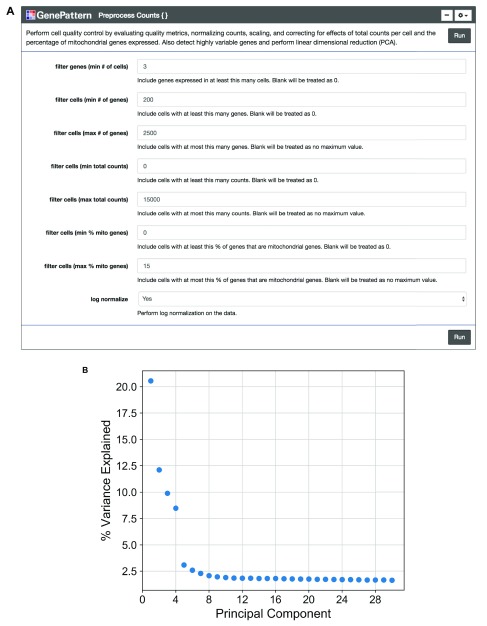
Figure 2. Preprocessing count data.
( A) The “Preprocess Counts” function is presented using the GenePattern UI Builder. Here the user specifies thresholds for filtering samples and for performing log normalization. ( B) A scatterplot showing the percent variance explained by each individual principal component.

