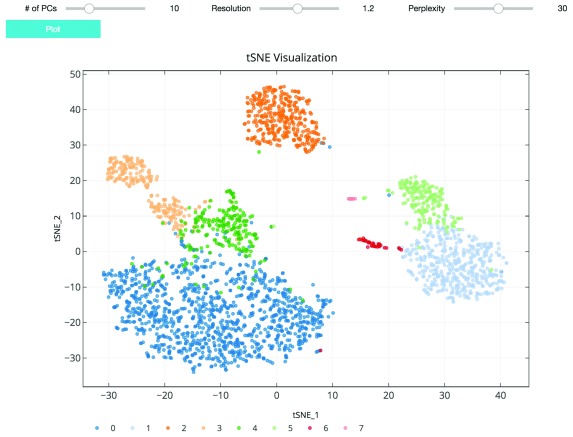
Figure 3. t-SNE plot visualizing cluster assignments of cells.
The clustering parameters can be changed using the sliders and re-plotted with the “Plot” button. Cells are projected into t-SNE space, with the first two t-SNE components as the axes of the plot. Cluster assignments of cells are defined by Louvain clustering and denoted as distinct colors.

