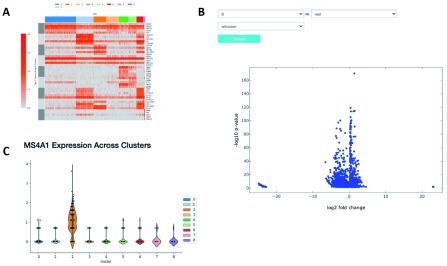
Figure 4. Relative expression of marker genes.
( A) A heatmap showing the expression of the top 10 differentially expressed markers of each cluster across all cells. ( B) A volcano plot illustrating the genes differentially expressed between two clusters or one cluster and the rest. ( C) A violin plot showing the expression of that gene in each cluster.

