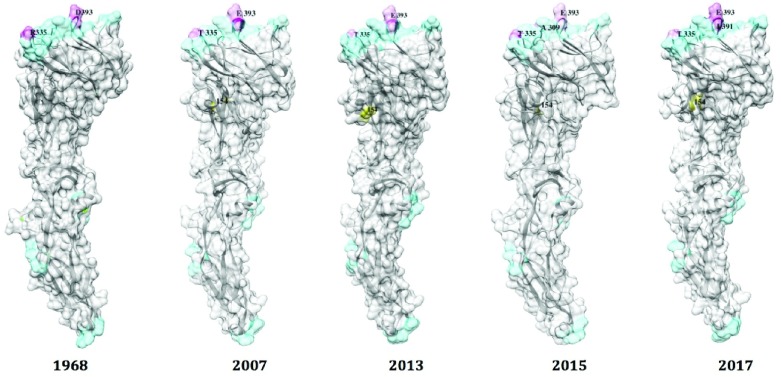
Figure 3. Comparison of B-cell epitopes of monomeric E between the years 1968, 2007, 2010, 2015, and 2016.
Homology models of E were built from PDB: 5GZN chain A from strains of following E sequences: AMR68906| Homo sapiens |Nigeria|09/09/1968, ACD75819| Homo sapiens |Micronesia|01/06/2007, ANO46307| Homo sapiens/French Polynesia/11/2013, AMX81917/Homo sapiens/Thailand/16/01/2015, and AMQ48986 | Homo sapiens |USA|02/02/2016. Color blue color represents amino acids conservation at B-cell epitopes and color pink represents amino acids substitutions. Yellow label represent N-glycosylation potential of E.

