
Figure 3.
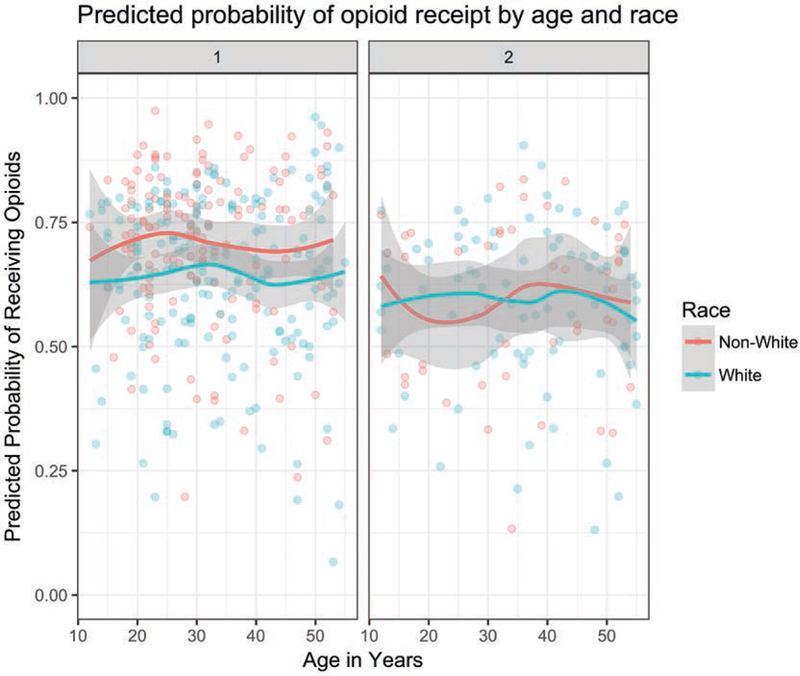
Sensitivity analysis of age-related effects. In adjusted analysis, Caucasian and non-Caucasian patients did not differ on the odds of receiving opioids across the age range of the study sample. The curves were generated using a GAM smoother from ggplot2 in R. Figure displays 95% CIs.