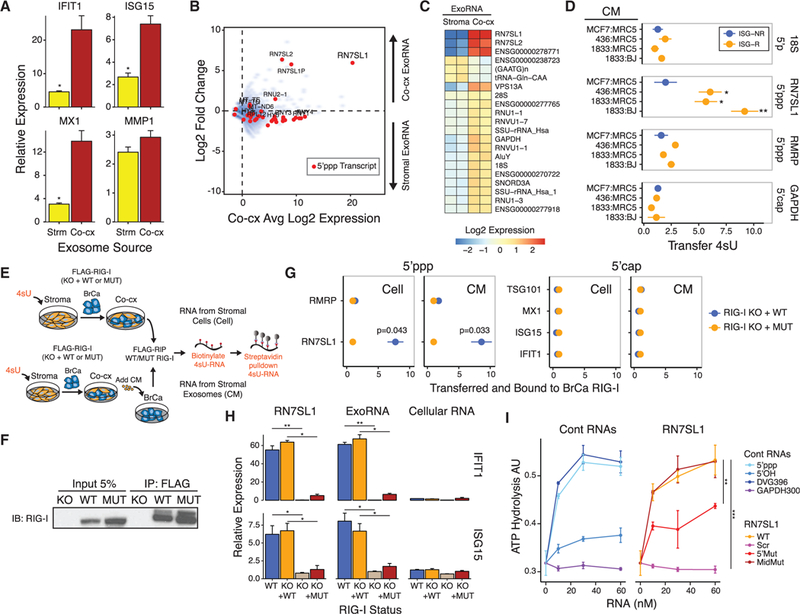
Figure 3. 5’ppp Stromal RN7SL1 Is Transferred to Breast Cancer Cells by Exosomes to Activate RIG-I.

(A) ISG expression in 1833 breast cancer cells after addition of exosomes from MRC5 stromal cell mono-culture(Strm) or from co-culture of1833 and MRC5 cells (Co-cx) (n = 3). Values are relative to mock control.
(B) ExoRNA and 5’ppp exoRNA enriched in ISG-R co-culture exosomes. Shown is average expression (Log2) by exoRNA-seq in co-culture versus fold change from co-culture compared to MRC5 stromal cell mono-culture (n = 2). Transcripts identified by 5’ppp-seq are shown in red. ExoRNA was rRNA-depleted.
(C) Differentially expressed exoRNA from MRC5 mono-culture (Stroma) compared to co-culture of 1833 and MRC5 cells (Co-cx) (n = 2).
(D) Relative transfer of indicated stromal 4sU RNA (right margin) to breast cancer cells after addition of conditioned media (CM) from 4sU-labeled MRC5 or BJ fibroblasts co-cultured with either ISG-R (orange) or ISG-NR (blue) breast cancer cells (n = 3).
(E) Schema to measure 4sU-labeled stromal RNA bound to breast cancer RIG-I after co-culture (Cell, top schema) or after addition of co-culture conditioned media (CM, bottom schema).
(F) Representative immunoprecipitation of FLAG-RIG-I.
(G) Quantitation of indicated 4sU-labeled stromal RNA transferred and bound to wild-type RIG-I (blue) or RIG-IK858/861A (orange) reconstituted in RIG-I KO 1833 cells after co-culture (Cell) or addition of co-culture CM (CM) (n = 3).
(H) ISG expression after transfection of RN7SL1, exoRNA from ISG-R co-culture, or cellular RNA into 1833 cells with wild-type(WT)or RIG-I knockout (KO), or into 1833 RIG-I KO cells restored with either wild-type RIG-I (KO + WT) or RIG-IK858/861A (KO + MUT) (n = 3). Values are relative to mock control.
(I) ATP hydrolysis assay for recombinant RIG-I activation by increasing concentrations of RN7SL1 and mutants (right) or control RNAs (left) (n = 3). Error bars are SEM of biological replicates and *p < 0.05, **p < 0.01, ***p < 0.001. See also Figure S3 and Table S1.
