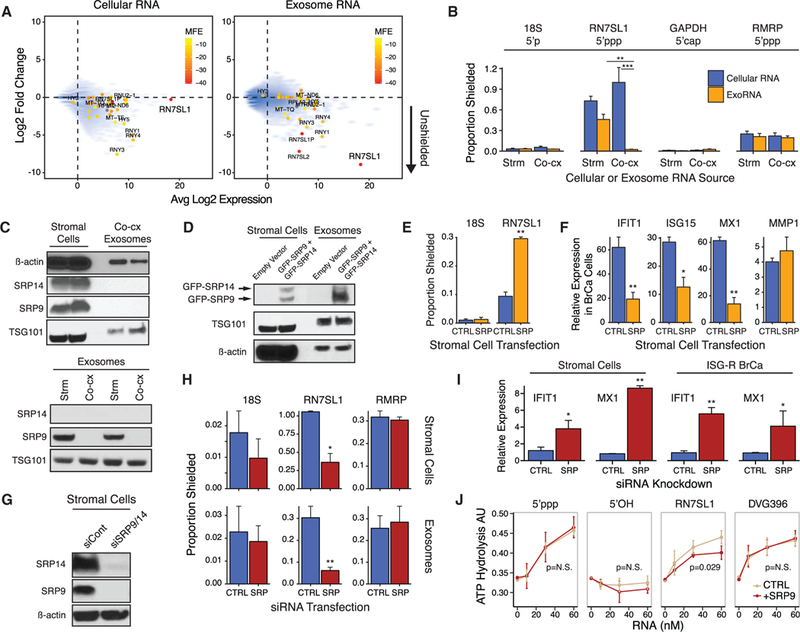
Figure 4. SRP9 and SRP14 Regulate RN7SL1 Shielding in Cells and Exosomes and the Ability to Stimulate RIG-I.

(A) Expression of cellular RNA (left) or exoRNA (right) from 1833 ISG-R co-culture versus degree of RNA binding protein (RBP) shielding. RBP shielding (y axis) is determined by fold change in RNA expression after MNase treatment with or without detergent (n = 2). Smaller y axis values indicate more unshielding. Transcripts identified by 5’ppp-seq are denoted by solid circles and color-coded based on normalized minimum free energy (MFE) whereby lower MFE predicts more extensive secondary structure.
(B) Extent of RBP-shielding of indicated RNAs in cells(Cellular RNA) or exosomes (ExoRNA) isolated from eitherMRC5 stromal mono-culture (Strm) or co-culture with 1833 breast cancer cells (Co-cx). Proportion shielded is determined by MNase treatment with and without detergent followed by qRT-PCR (MNase-qRT- PCR) (n = 3).
(C) Immunoblot of SRPs and indicated proteins in MRC5 stromal cells and exosomes from ISG-R co-culture (top), or in exosomes from stromal mono-culture (Strm) or ISG-R co-culture (Co-cx) (bottom). Each lysate is a biological replicate normalized to levels of RN7SL1 RNA.
(D) Immunoblot of indicated proteins in stromal cells and exosomes after 1833 ISG-R co-culture using MRC5 stromal cells transfected with GFP-SRP9 and GFP-SRP14.
(E and F) RBP-shielding for the indicated exoRNAs (E) or (F) relative expression of ISGs in sorted 1833 breast cancer cells after co-culture using MRC5 cells transfected with control vector (CTRL) orGFP-SRP9 and GFP-SRP14(SRP) (n = 3). Expression values are relative to 1833 cells in mono-culture. MMP1 is a non-ISG not expected to change.
(G and H) Expression ofSRP9 and SRP14protein in MRC5 cells after siRNA knockdown (G), and (H) resulting RBP-shielding for the indicated RNA in MRC5 cells (top) or exosomes (bottom) (n = 4).
(I) ISG induction in MRC5 cells after SRP9/14 knockdown or in 1833 cells after addition of conditioned media from MRC5 knockdown cells (n = 4).
(J) Stimulation of recombinant RIG-I ATP hydrolysis activity by RN7SL1 with or without addition of equimolar amounts of recombinant SRP9 (n = 3). Error bars are SEM of biological replicates and *p < 0.05, **p < 0.01. See also Figure S4.
