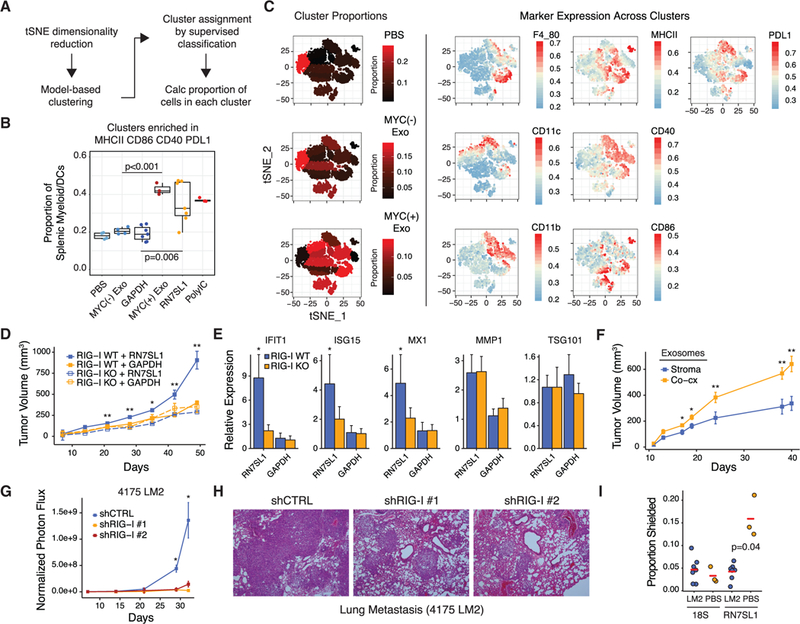
Figure 6. Unshielded RN7SL1 in Exosomes Functions as a DAMP and Promotes Breast Cancer Progression and Metastasis.

Fora Figure360 presentation of Figure 6, see http://dx.doi.org/10.1016/j.cell.2017.06.031#mmc4.
(A) Schema for unbiased flow cytometry analysis of splenic myeloid/DC populations using tSNE dimensionality reduction, cluster identification, and supervised classification.
(B) Summary of the proportion of cells in splenic myeloid/DC clusters enriched in MHCII, CD86, CD40, and PDL1 after injection of the indicated exosomes or RNA.
(C) Representative data for exosome injected groups. See Figure S6 for other groups. Shown are proportions of cells in each cluster as represented by the color gradient on the tSNE plot (left), which maps cells to a two-component dimensionality reduced space. Expression of the indicated markers is overlaid on the tSNE plot to visualize color-coded mean fluorescence intensities across clusters (right).
(D and E) Tumor growth curves (D) and (E) expression of ISGsfor 1833 ISG-R breast cancer cells with or without RIG-I knockout xenografted into athymic mice and intratumorally injected three times per week with the indicated liposome-encapsulated RNA (n = 5 per group). ISGs were measured by qRT-PCRwith human- specific primers. TSG101 and MMP1 are non-ISGs not expected to change.
(F) Tumors growth curves of 1833 tumors injected with exosomes from MRC5 stromal cells or 1833 ISG-R co-culture (n = 5 per group).
(G and H) Normalized photon flux (G) or (H) H&E staining of mouse lungs after tail vein injection of luciferase-labeled 4175 LM2 ISG-R breast cancer cells expressing one of two shRNAs to RIG-I or a control shRNA (n = 5 per group).
(I) RBP-shielding of mouse RN7SL1 or 18S rRNA from serum exosomes 2 weeks after tail vein injection with 4175 LM2 breast cancer cells or with PBS. Mouse-specific primers were used.
Error bars are SEM of biological replicates and *p < 0.05, **p < 0.01. See also Figure S6.
Figure360: an author presentation of Figure 6.
