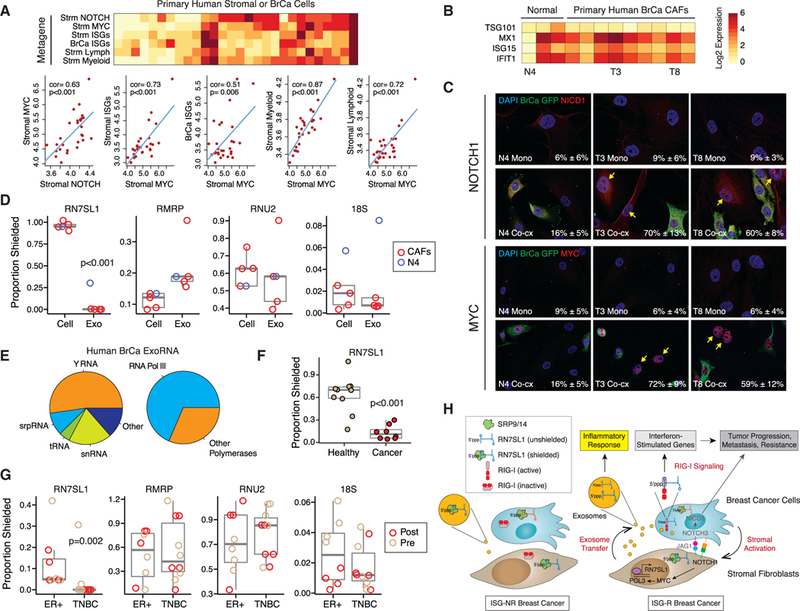
Figure 7. Stromal NOTCH1-MYC Signaling, Inflammatory Gene Expression, and Unshielded RN7SL1 ExoRNA from Primary Human Breast Cancers.

(A) Heatmap and correlation plots of metagenes for NOTCH, MYC, ISGs, or myeloid or lymphoid genes In stromal (Strm) or breast cancer (BrCa) cells from laser- captured micro-dissected human tumors. Red is high expression and yellow is low. Univariate correlations and p values are shown. Significance was confirmed by gene set enrichment analysis compared to random genes.
(Band C) ISG expression after co-culture of 1833ISG-R breast cancer cells with either CAFs from surgically resected primary human breast cancers or fibroblasts from the contralateral breast (Normal). (B) Select fibroblasts from each group are labeled below the heatmap and (C) used to examine activated NOTCH1 (NICD1) and nuclear MYC expression after mono-culture (Mono) or co-culture with GFP-labeled 1833 breast cancer cells (Co-cx). Percentage of NICD1(+) or MYC(+) stromal cells averaged from multiple high-powered fields is indicated in the lower right corner (n = 2).
(D) RBP-shielding of cellular RNA(Cell) from primary CAFs or exoRNA (Exo) isolated from 1833 ISG-R co-cultures. Values from N4 fibroblast (blue) isolated from normal breast is shown for comparison.
(E) Average distribution of exoRNA in each RNA class (left) or by POL3 regulation (right) from serum exosomes of breast cancer patients (n = 2). Only the top 200 highest expressed non-rRNA transcripts are considered.
(F and G) RBP-shielding of exoRNA from cancer patients or normal volunteers without cancer (Healthy) (F), or (G) from a cohort of breast cancer patients stratified by ER(+) or triple negative breast cancer (TNBC) subtype. For the breast cancer cohort, samples collected before (Pre) or after (Post) surgery are labeled. See Tables S2 and S3 for patient details.
(H) Model for coupling stromal activation to regulation and deployment of unshielded RN7SL1 exoRNA. See text for details. Genes labeled in gray are primarily described in our previous study (Boelens et al., 2014).
