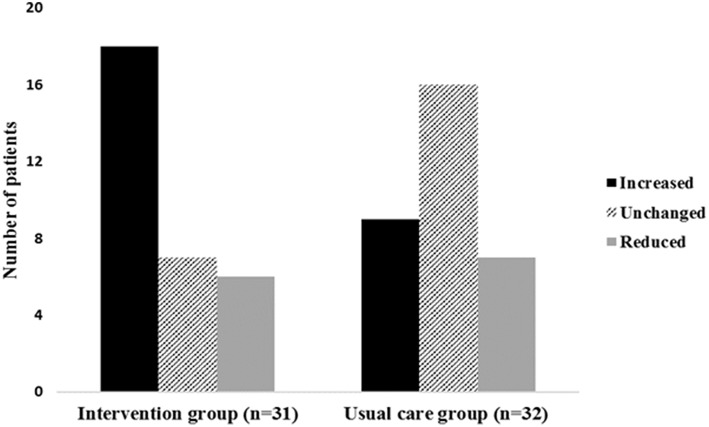
Figure 2.
Change in vigorous-intensity activity from baseline to the post-intervention assessment in both groups. The figure shows the number of patients in each group who either increased, did not change or reduced their time spent on vigorous-intensity activity from baseline to post-intervention assessment.

