Figure 2.

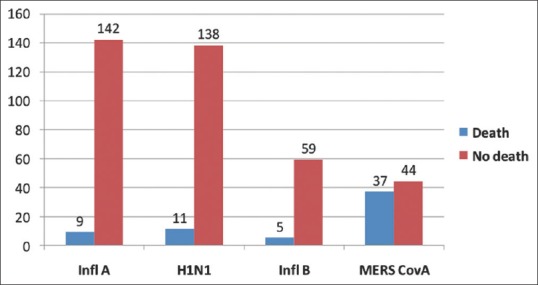
Bar chart presenting the frequency number of death among the studied confirmed viral pneumonia by type of associated virus January, 2012–October, 2015 (total: 448 cases)

Bar chart presenting the frequency number of death among the studied confirmed viral pneumonia by type of associated virus January, 2012–October, 2015 (total: 448 cases)