
Figure 2.
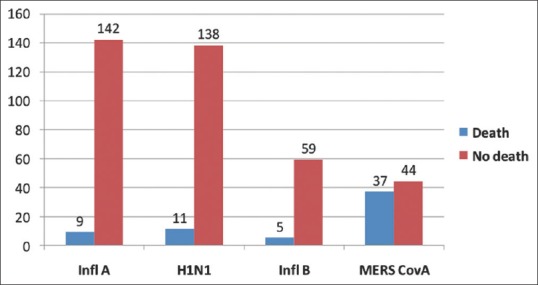
Bar chart presenting the frequency number of death among the studied confirmed viral pneumonia by type of associated virus January, 2012–October, 2015 (total: 448 cases)
Official websites use .gov
A
.gov website belongs to an official
government organization in the United States.
Secure .gov websites use HTTPS
A lock (
) or https:// means you've safely
connected to the .gov website. Share sensitive
information only on official, secure websites.
Bar chart presenting the frequency number of death among the studied confirmed viral pneumonia by type of associated virus January, 2012–October, 2015 (total: 448 cases)