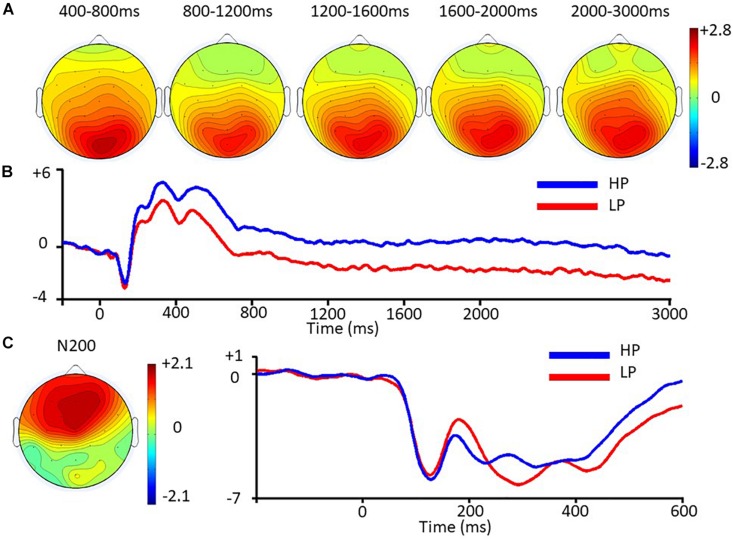
FIGURE 3.
ERPs as a function of behavioral preferences. (A) Left: Two-dimensional scalp map plotting contrasts of late positivities between HP and LP. (B) ERP waveforms from Pz time-locked to the onset of pictures displaying consumer goods (second phase) separated by behavioral preferences. Amplitude in microvolts is on the y axis and time in milliseconds on the x axis. (C) Left: Two-dimensional scalp maps plotting contrasts of N200 peak to peak amplitudes between HP and LP. Right: ERP waveforms from Fz time-locked to the onset of pictures displaying consumer goods (second phase) separated by behavioral preferences. Amplitude in microvolts is on the y axis and time in milliseconds on the x axis.

