Figure 5.
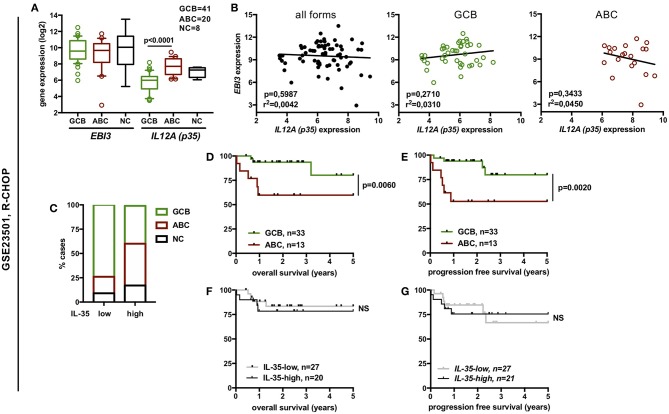
Expression of IL-35 among the different molecular forms of DLBCL and correlation with overall or progression free survival of the patients from the GSE23501 dataset. (A) Gene expression of EBI3 and p35 among the various molecular forms of DLBCL defined by gene profiling (log2 scale). Box plot limits indicate the 10–90 percentile of normalized intensity values, and outliers are shown. p-values of student t-tests are indicated. (B) Correlation between EBI3 and p35 expression levels (log2 scale) among all molecular forms (GCB + ABC + NC) or within GCB or ABC forms. R-square and p-value (Pearson correlation test) are indicated. (C) Distribution of ABC, GCB, and NC cases among “IL-35-low” and “IL-35-high” DLBCL cases. (D–G) Percentage (y-axis) of overall survival or progression-free survival over time (x-axis) (Kaplan-Meier survival curve) of DLBCL patients classified by molecular subtypes (D,E) or by IL-35 expression levels (F,G). p-values of log-rank test are indicated. NS, not significant.

