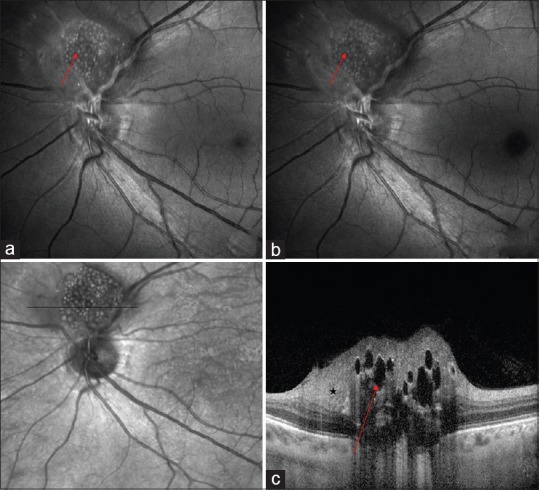
Figure 2.

Green reflectance (a) and blue reflectance (b) highlighted calcification as multiple hyperreflective dots (red arrows). Spectral domain optical coherence tomography (c) showed moth-eaten optically empty spaces (red arrow) and area of retinal thickening adjacent to the elevated lesion (star)
