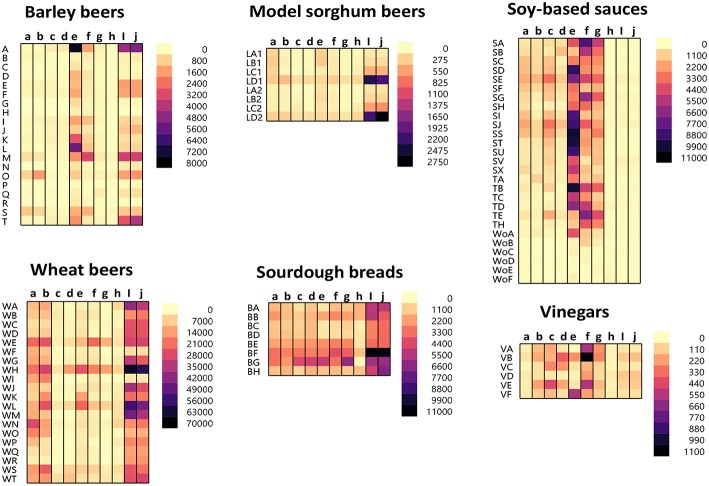
Figure 1.
Apparent gluten concentration (μg/mL) profiles of different categories of fermented-hydrolyzed foods (20 barley beers, 20 wheat beers, 8 model sorghum beers containing 200 μg/mL gluten brewed in the presence and absence of PEP, 8 sourdough breads, 27 soy-based sauces, and 6 vinegars) as analyzed by the multiplex-competitive ELISA utilizing gluten specific antibodies from the AgraQuant Gluten G12 (a), GlutenTox ELISA Competitive G12 (b), RIDASCREEN Gliadin (c), RIDASCREEN Gliadin Competitive (d), Veratox for Gliadin, cat # 8480 (e), Neogen Veratox for Gliadin R5 (f), Microbiologique Gluten (g), Morinaga Institute of Biological Sciences, Inc. (MIoBS) Gliadin (h), and AllerTek Gluten (25 (i) and 10 μg/mL (j), respectively coating antigen concentration) ELISA kits (56). For soy-based sauces, SA-SX represents soy sauces, TA-TH represents teriyaki sauces, and WoA-WoF represents Worcestershire sauces. For the model sorghum beers, LA-LC represent 200 ppm gluten containing beers brewed in the presence of different concentrations of PEP (25, 4, and 0.5 mL/31 gallon of wort, respectively) and LD represents 200 ppm gluten containing beer brewed in the absence of PEP. LA1-LD1 and LA2-LD2 represents two different replicate brews.

