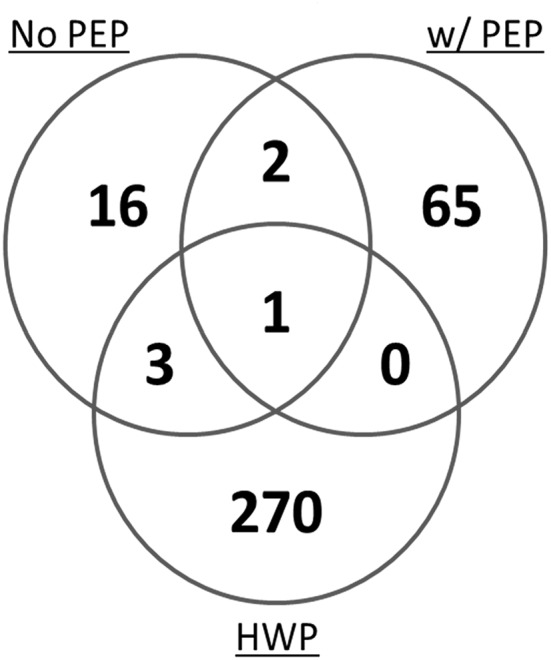
Figure 3.

Venn diagram of the total number of unique gluten peptides identified by mass spectrometry in a model sorghum beer containing 200 μg/mL gluten, brewed in the presence and absence of PEP, comparing it to that of the HWP. The samples were analyzed in triplicate and only peptides that were identified in at least two of the three injections were included (17).
