
Fig. 2.
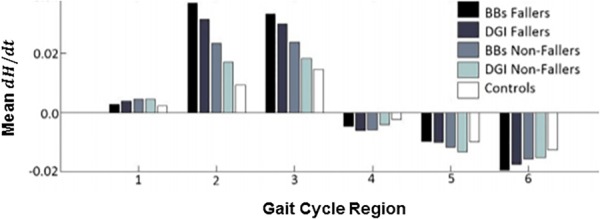
The mean, time rate of change of H () in the frontal plane during the six regions of the gait cycle during steady-state walking. Each bar depicts the mean values across the subjects grouped as fallers and nonfallers based on their BBS and DGI scores. There is a significant difference in between the BBS fallers and nonfallers during the paretic leg single stance (regions 2 and 3). Region 1 is the first double support phase, regions 2 and 3 are the first and second halves of single-leg stance, respectively, region 4 is the second double support phase, and regions 5 and 6 are the first and second halves of swing, respectively. Figure adopted from Ref. [43].