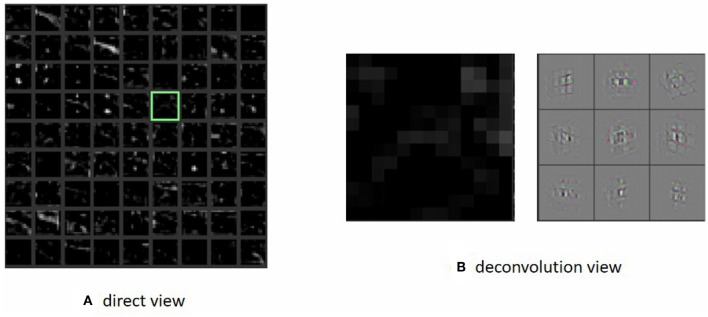
Figure 5.
We visualized the first layer and obtain a direct view (left). However, many grids contain unreadable information such as the grid marked with a green frame. Because the first layer's output was quite abstract, we then visualized the last layer using deconvolution and obtained the right picture. It seemed to represent the wall element in the original graph. That means the agent could pay attention to the wall and then take suitable actions. Panel (A) shows the direct view visualization of the first layer of CNN. Panel (B) shows the visualization of the last layer of CNN using deconvolution.

