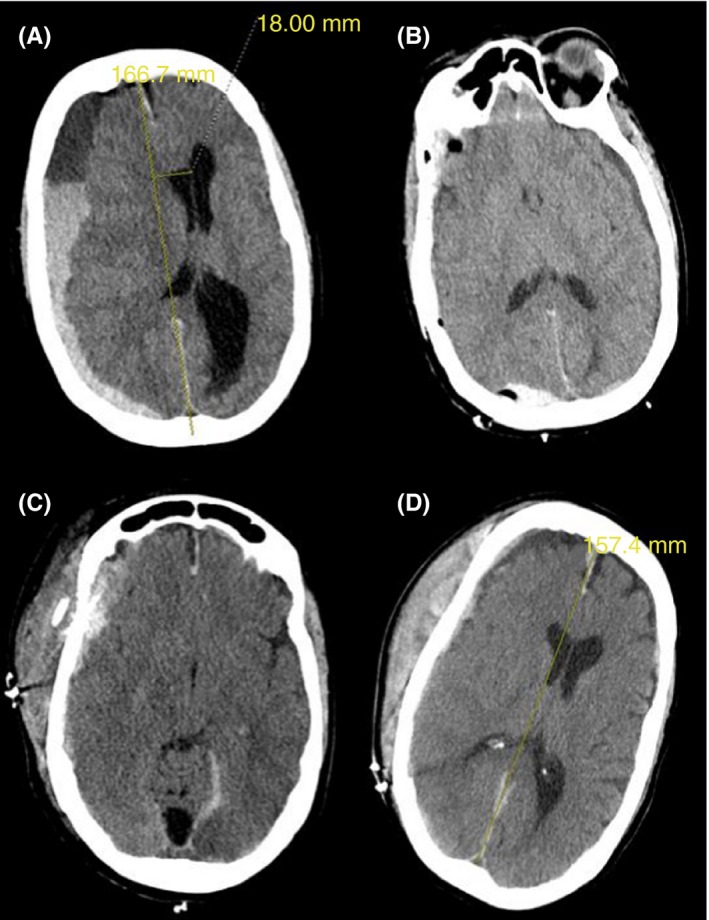
Figure 1.

Serial cranial computed tomography. (A: D1) Large subdural hematoma, leftward midline shift. (B: D2) Improvement in subdural hematoma after craniotomy. (C: D4) New scalp hematoma, worsening subdural hematoma and worsening midline shift. (D: D9) Stable scalp hematoma, decrease in subdural hematoma, decreased midline shift. D represents day of hospitalization
