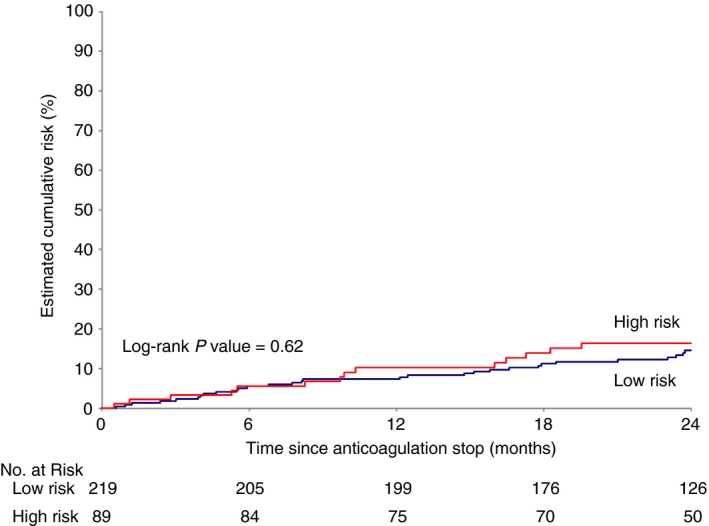
Figure 1.

Kaplan Meier curve showing estimated cumulative incidence of recurrent deep vein thrombosis and/or pulmonary embolism in the first 2 years after treatment cessation according to the VTE‐BLEED score (high: red curve; low: blue curve). Number of patients left in analysis are indicated in the table
