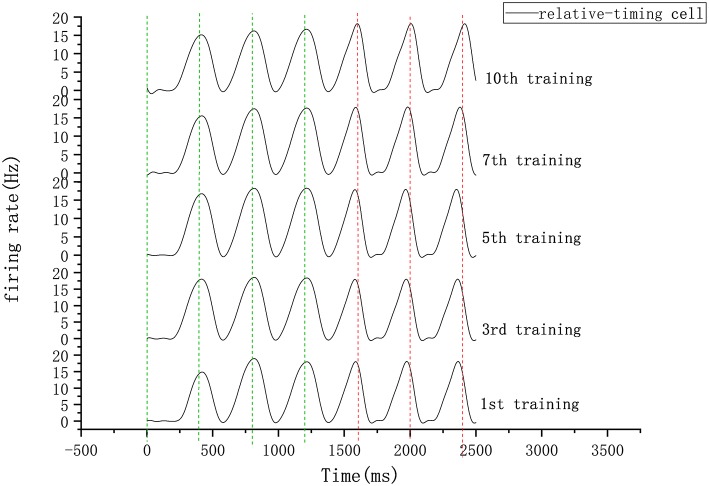
Figure 8.
Firing rate diagram (after smoothing) of relative-timing cells during several training sessions. Here the interval length is 400 ms. The green-dashed lines represent the occurrence of external synchronization signals and the red-dashed lines indicate the desired tapping time points in the continuous phase.

