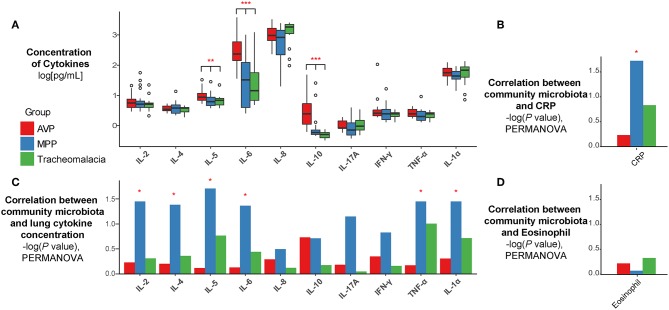
Figure 3.
The concentration of cytokines and their correlations with microbiota were disease-specific. (A) The expression of cytokines were disease-specific, concentration of cytokines were recalculated by log10 and drawn as boxplot. (B–D) The correlation between microbiota and cytokines/CRP/Eosinophil were also disease-specific. Statistical differences were marked as p-value on the top of cytokines/CRP. Red, blue, and green represent the patients from AVP, MPP, and tracheomalacia, respectively. *, **, and *** represent q-value of Kruskal-Wallis test ≤0.05, ≤0.01, and ≤0.001, respectively.

