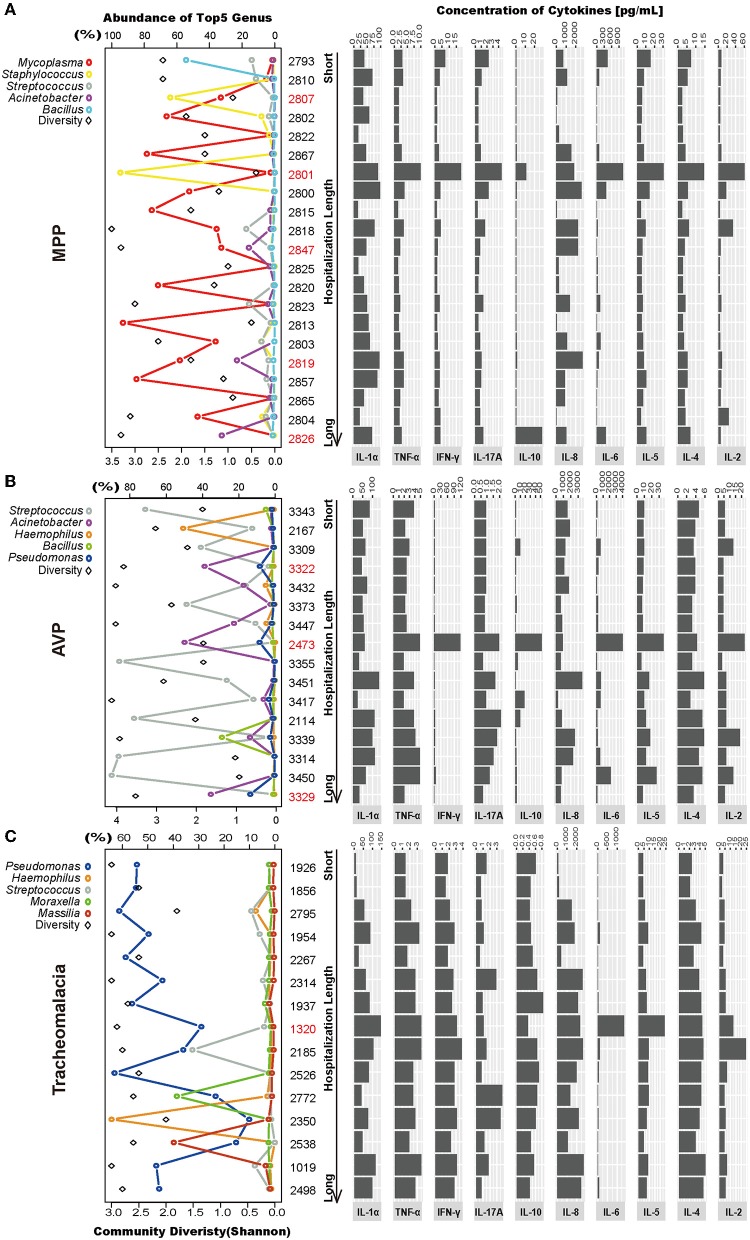
Figure 4.
Intragroup microbial structure and cytokines concentration showed individual difference. Top 5 genera and community diversity were used to show community structure in each group (on the left). The concentrations of 10 cytokines were drawn on the right. The patients were sorted by hospitalization length. (A–C) Represent the MPP, AVP, and tracheomalacia group, respectively. The top five genera were painted with specific colors and circle, the diversity was shaped rectangle and in black color. Special samples in each group were colored red.

