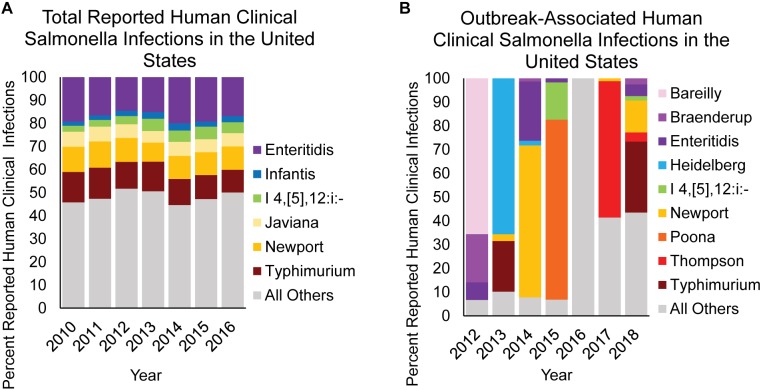
FIGURE 6.
NTS causing overall vs. confirmed outbreak-associated infections in humans. The contribution of select NTS serovars to (A) overall human clinical infections vs. (B) human clinical infections confirmed from a foodborne outbreak are shown as percent infection for a given category. Data are modified from Centers for Disease Control and Prevention [CDC] (2016, 2018).

