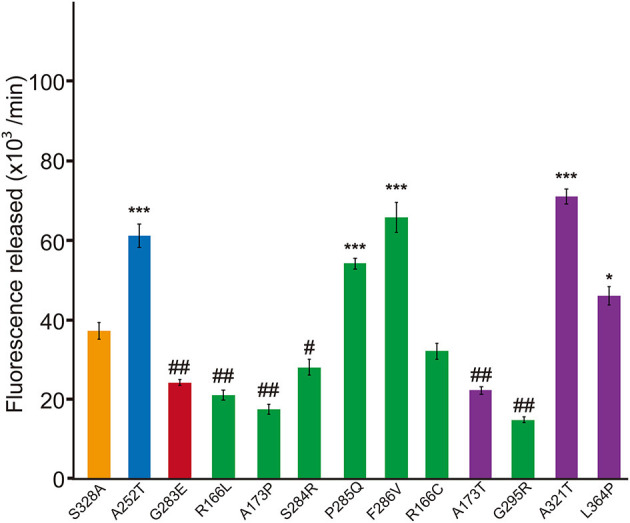
Figure 3.

Dominant-negative effects of missense HTRA1s identified in symptomatic carriers. Protease activities of mixtures of each missense HTRA1 with WT calculated from the slope of the linear portion of normalized fluorescence vs. time (30, 60, and 90 min) plots. Orange, S328A/WT, a positive control for a dominant-negative effect. Blue and red bars indicate protease activities of A252T/WT and G283E/WT, respectively, negative and positive controls for dominant-negative effect, respectively. Green bars, missense HTRA1s identified in symptomatic carriers. Purple bars, missense HTRA1s found only in CARASIL patients. I-bars indicate standard errors (SE). Statistical comparisons of protease activities between each mutant HTRA1/WT and S328A/WT were performed with one-way analysis of variance followed by Dunnett's post hoc test. ***P < 0.0001; *P < 0.05 for increases in protease activities for each HTRA1/WT relative to S328A/WT. ##P < 0.0001; #p < 0.05 for differences for HTRA1/WT mixtures relative to S328A/WT.
