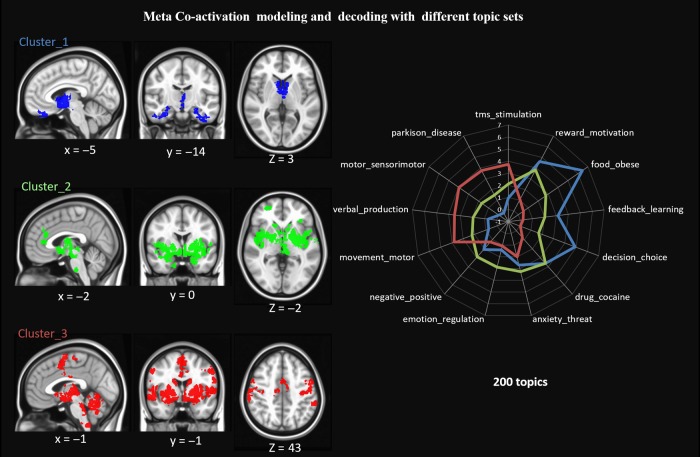
Figure 3.
Co-activation map of each cluster and its functional profiles. For each cluster, thresholded whole-brain co-activation maps were generated (FDR corrected P < 0.05 and cluster size >200 mm3). All maps were rendered on MNI template. Based on 200 topics, each cluster was profiled to its most preferred topics. Each cluster showed distinct functional preference. The dice coefficients were further fisher-Z scored.

