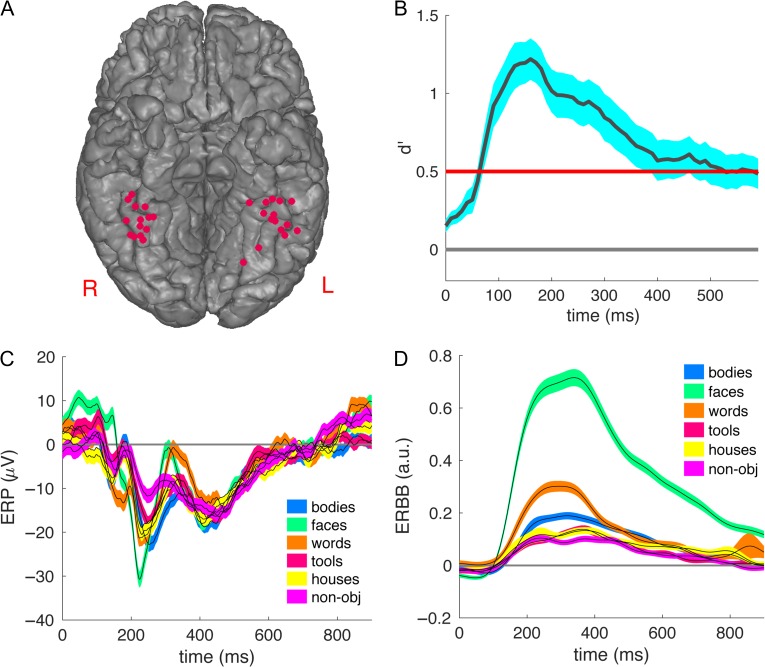
Figure 1.
The face sensitive electrodes in the fusiform. (A) The localization of the 31 face sensitive electrodes in (or close to) the fusiform, mapped onto a common space based on MNI coordinates. We moved depth electrode locations to the nearest location on the overlying cortical surface, in order to visualize all the electrodes. (B) The timecourse of the sensitivity index (d′) for faces versus the other categories in the 6-way classification averaged across all 31 fusiform electrodes. The shaded areas indicate standard error of the mean across electrodes. The red line corresponds to P < 0.01 with Bonferroni correction for multiple comparisons across 60 time points. (C) The ERP for each category averaged across all face sensitive fusiform electrodes. The shaded areas indicate standard error of the mean across electrodes. (D) The ERBB for each category averaged across all face sensitive fusiform electrodes. The shaded areas indicate standard error of the mean across electrodes.

