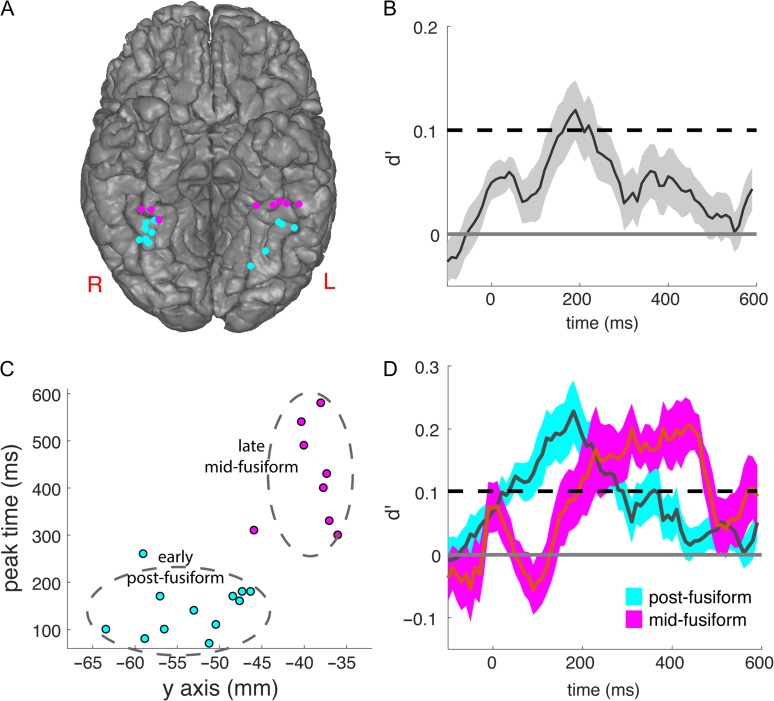
Figure 2.
The timecourse of the facial expression classification in fusiform. (A) The locations of the electrodes with significant face expression decoding accuracy, with the posterior fusiform group colored in cyan and the midfusiform group colored in magenta. (B) The timecourse of mean and standard error for pairwise classification between different face expressions in all 31 fusiform electrodes. The shaded areas indicate standard error of the mean across electrodes. Dashed line: P = 0.05 threshold with Bonferroni correction for 60 time points (600 ms with 10 ms stepsize). (C) The time of the peak classification accuracy was plotted against the MNI y-coordinate for each single electrode with significant expression classification accuracy. K-means clustering partitions these electrodes into posterior fusiform and midfusiform groups. Dashed oval represent the 2-σ contour using the mean and standard deviation along the MNI x- and y-axes. (D) The mean and standard error for pairwise classification between different face expressions in posterior fusiform electrodes and midfusiform electrodes. The posterior group peaked at 180 ms after stimulus onset and the midfusiform group had an extended peak starting at 230 ms and extending to 450 ms (both P < 0.05, binomial test, Bonferroni corrected; dashed line: P = 0.05 threshold with Bonferroni correction for 60 time points [600 ms with 10 ms stepsize]). The shaded areas indicate standard error of the mean across electrodes. See supplement for receiver operator characteristic (ROC) curves validating classification analysis (Fig. S2).

