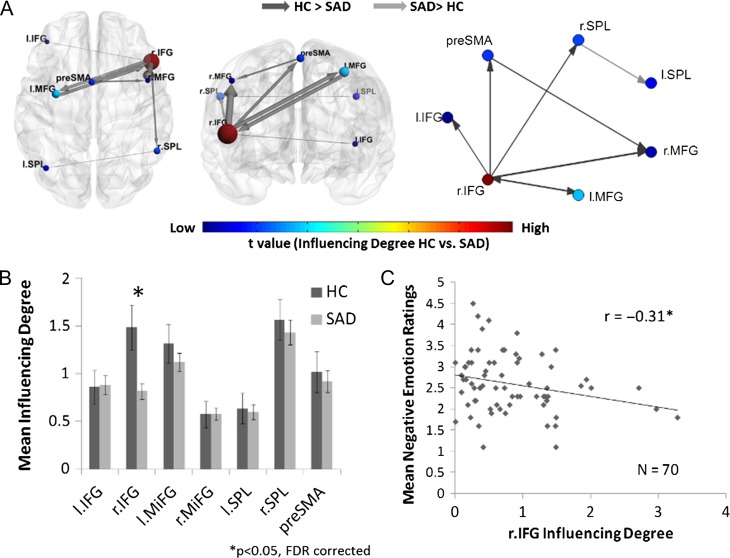
Figure 3.
Intracognitive regulation network influence during the reappraise condition. (A) The cognitive reappraisal brain network illustration and graph visualization. Each region is color-coded according to the t statistic value from the t-test between the “Influencing Degree” of the 2 groups. All pairwise ROIs with connections, significant at the P < 0.05 level, are plotted as edges. (B) The regions’ Influencing Degree averaged over all 70 SAD patients and 25 healthy controls. The intranetwork analysis found that the SAD group had significantly lower right IFG influence within the cognitive reappraisal network. (C) In addition, the right IFG’s intranetwork Influencing Degree of SAD patients was negatively correlated with the subjective mean negative emotion ratings during the reappraisal condition. Therefore, as the SAD patients’ right IFG influence on the cognitive reappraisal network regions was higher, the less they reported negative emotions.

