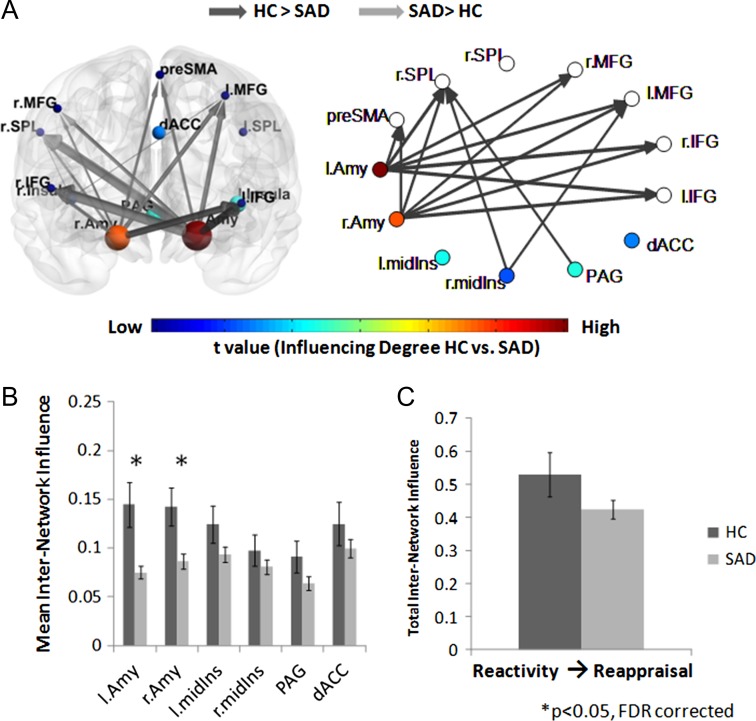
Figure 5.
Emotional reactivity network influence on the cognitive reappraisal network during the reappraise condition. (A) The significant group differences illustrated on the brain network illustration and graph visualization. Each region is color-coded according to the t statistic value from the t-test assessing groups difference in internetwork influence. All pairwise ROIs with connections, significant at the P < 0.05 level, are plotted as edges. (B) The internetwork influence of the emotional reactivity network regions on the cognitive reappraisal regions averaged over all 70 SAD patients and 25 healthy controls. The SAD group showed significantly lower right and left amygdala influence on the cognitive reappraisal network. (C) As opposed to significantly decreased influence of the reappraisal network on the reactivity network, the total influence of the emotional reactivity network on the cognitive reappraisal network was not significantly different between the SAD and HC groups.

