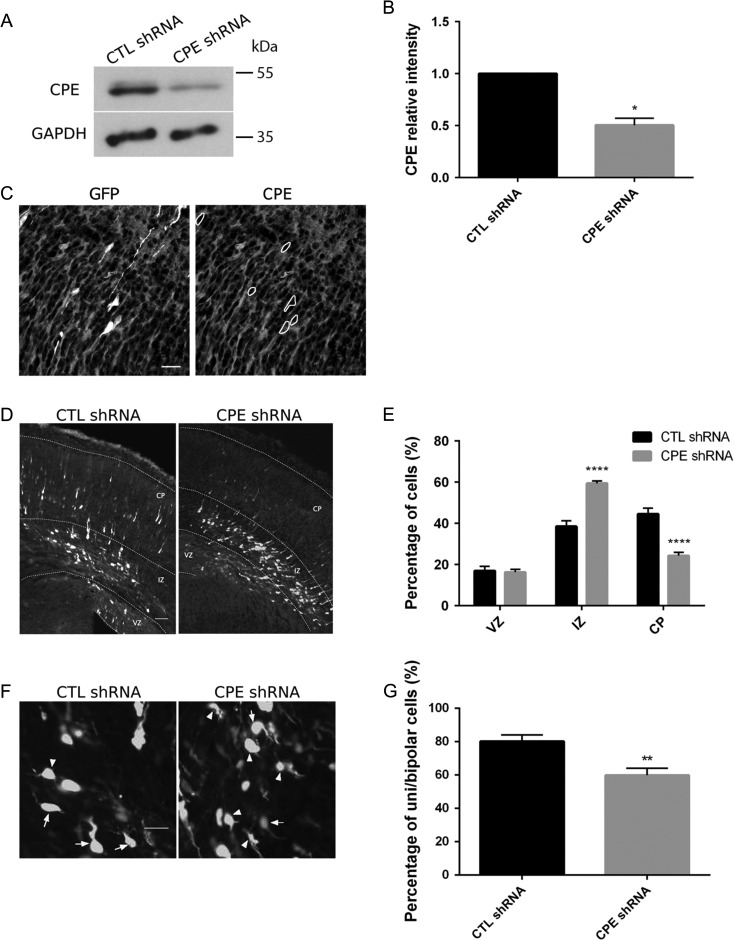
Figure 2.
CPE is required for proper cortical neuron migration. (A) CPE shRNA knockdown efficiency in cortical neurons. E18 cortical neurons were electroporated with pGE-control shRNA (CTL shRNA) or pGE-CPE shRNA (CPE shRNA) before plating using Amaxa Rat Neuron transfection kit. After 96 h, cells were lysed, and extracted proteins were resolved using SDS-PAGE. Proteins were transferred to membrane and probed with antibodies to CPE and GAPDH. Representative blots are shown. (B) Quantitation of CPE protein levels relative to control (normalized to GAPDH). Error bars indicate ± SEM. n = 3. *P < 0.05 by Student’s t-test. (C) CPE shRNA knockdown specificity in embryonic neocortex. CPE shRNA construct including GFP marker was electroporated into the lateral ventricle of E14.5 mice and analyzed 3 days later. Transfected cells are GFP-positive (white); CPE protein (gray) is detected by immunostaining. Representative images of coronal sections of the lateral neocortex are shown. GFP-positive cells (marked by the dotted circles) in the left image show low levels of CPE protein as demonstrated on the right. Scale bar = 25 μm. (D) Mice at E14.5 were electroporated in utero with constructs as indicated, and brains were analyzed at E17.5. Representative images of coronal brain sections are shown for each condition. White, transfected cells; gray, Hoechst labeling of nuclei. Scale bar = 50 μm. (E) Quantitation of the percentage of transfected cells in each cortical area. Error bars indicate ± SEM. n = 7, CTL shRNA; n = 7, CPE shRNA. ****P < 0.0001 as determined by 2-way ANOVA followed by Sidak’s multiple comparisons test. (F) Representative images of transfected cells in the IZ are shown for each condition. Arrows point to unipolar or bipolar cells; Arrowheads point to multipolar cells. Scale bar = 20 μm. (G) Quantitation of percentage of unipolar and bipolar cells under each condition. Morphology of transfected cells across the entire IZ was analyzed. Error bars indicate ± SEM. n = 7, CTL shRNA; n = 7, CPE shRNA. **P < 0.01 as determined by unpaired Student’s t-test.

