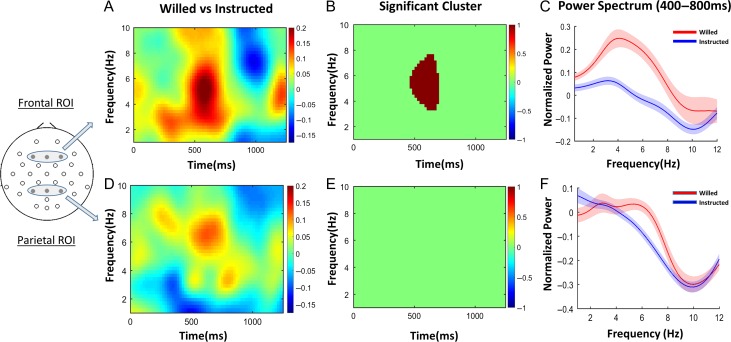
Figure 3.
Spectral analysis of willed and instructed attention. (A) Cue evoked spectrogram averaged across frontal regions of interest (ROI; shown at left). (B) The time–frequency cluster showing significant difference between willed and instructional cues (P < 0.05, cluster-based permutation test). (C) The power spectral density in the time period of interest (400–800 ms) showing clear increase in theta power (3–7 Hz) for willed compared with instructed attention (P < 0.05). (D)–(F) The same analyses applied to the EEG recorded from the parietal region of interest. No time–frequency clusters were significantly different between the 2 conditions in the parietal ROI. There was no difference in the theta band power in the time period 400–800 ms (P > 0.05).

