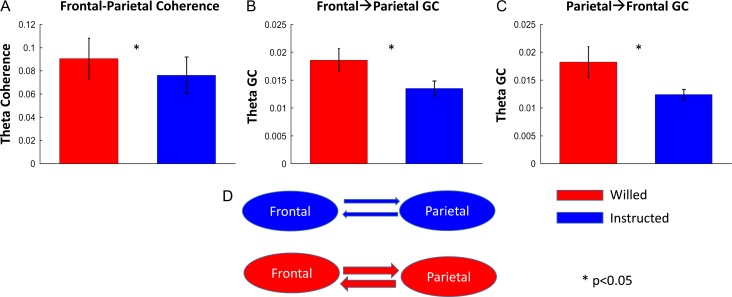
Figure 4.
Frontal–parietal theta connectivity (400–800 ms). (A) Bar plot showing significantly higher frontal–parietal theta coherence for choice cues as compared with instruction cues. (B, C) Bar plots showing a significant higher bidirectional Granger causality (GC) for choice cues. (D) A schematic diagram of the GC result.

