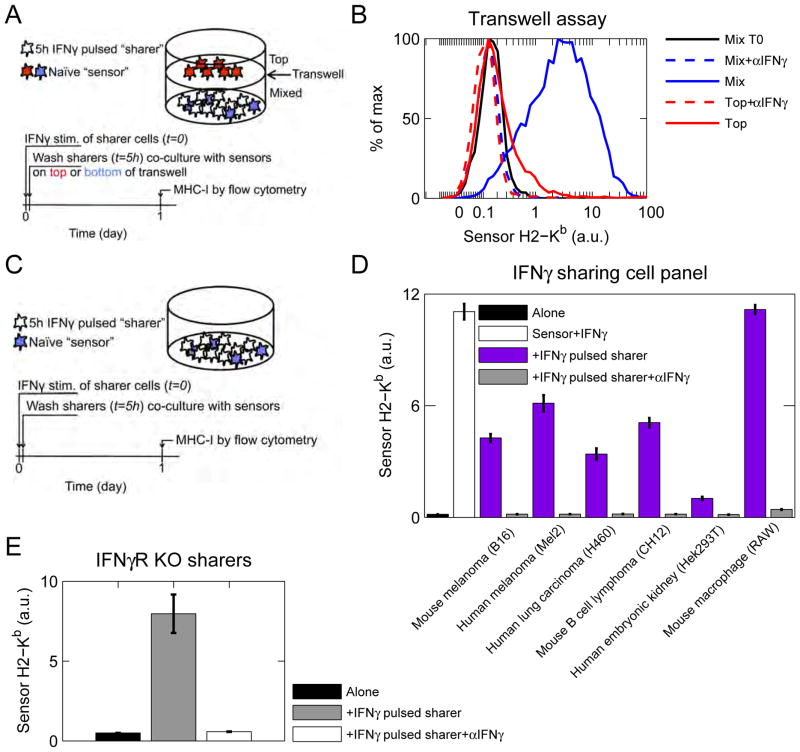
Figure 3. Cytokine-pulsed cells slowly release IFNγ.
See also Figure S3. (A) Diagram of transwell experiment. One cohort of B16 cells were pulsed with IFNγ, washed, and co-cultured with unstimulated B16 sensor cells in the bottom of a plate. Additional sensors were cultured in the top of a transwell. αIFNγ was added where indicated. (B) Sensor MHC-I (H2-Kb) expression was measured by flow cytometry. Experiment is representative of at least 3 independent experiments. (C) General experimental diagram for (D–F). One cohort of cells were pulsed with IFNγ, washed, and co-cultured with receptor-competent B16 sensor cells. αIFNγ was added where indicated. MHC-I was measured by flow cytometry. (D) B16, SK-Mel-2, H460, CH12, Hek293T, and RAW cells were pulsed with mouse IFNγ, washed, and co-cultured with unstimulated B16 sensor cells, Sensor MHC-I (H2-Kb) was measured by flow cytometry. (E) B16 IFNγR KO cells were pulsed with IFNγ, washed, and co-cultured with unstimulated B16 sensor cells. Sensor MHC-I (H2-Kb) was measured by flow cytometry. Data are representative of 2 independent experiments.

