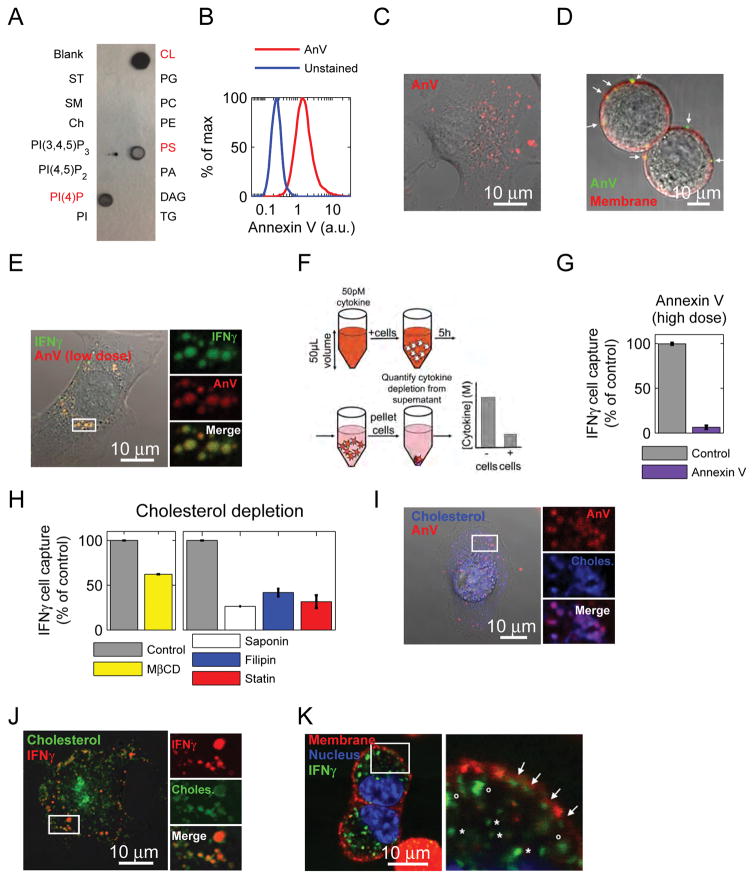
Figure 5. Phosphatidylserine is necessary for IFNγ cell binding.
See also Figure S5. (A) Lipid-spotted strips were incubated with 50pM IFNγ, probed with αIFNγ, and developed. For lipid key, see figure S6A. (B) Live cells were stained with Annexin V or kept in buffer alone. Cells were gated first as live (Dapi-). Fluorescence was quantified by flow cytometry. Staining is representative of 3 independent experiments. (C) IFNγR KO B16 cells were adhered to a glass bottom dish, stained with Annexin V, and imaged with confocal microscopy. Staining is representative of 3 independent experiments. (D) IFNγR KO B16 cells were stained with Annexin V, and the plasma membrane was stained with cell mask orange. Cells were imaged with confocal microscopy before they could adhere to a dish (to make subcellular detection of PS clearer). Arrows point to PS localized to the plasma membrane. Staining is representative of 2 independent experiments. (E) IFNγR KO B16 cells were adhered to a glass bottom dish, stained with low-dose Annexin V, then incubated with IFNγ-A647, washed, and imaged with confocal microscopy. Data are representative of 2 independent experiments. (F) B16 IFNγR KO cells were incubated with 50pM cytokine in 50μL volume for 5 hours. After 5h, supernatant was collected and the cell-mediated depletion of cytokine was quantified by bead-based ELISA. (G) IFNγR KO B16 cells were pre-treated with Annexin V, or Annexin V binding buffer before performing the IFNγ cell capture assay. Data are representative of at least 3 independent experiments. (H) IFNγR KO B16 cells were depleted of cholesterol using MβCD, Saponin, Filipin, or lovastatin. Then the IFNγ cell capture assay was performed. Data are representative of 3 independent experiments. (I) IFNγR KO B16 cells were adhered to a glass bottom dish, incubated with BODIPY-cholesterol, then stained with Annexin V. Images are representative of 2 independent experients. (J) IFNγR KO B16 cells were adhered to a glass bottom dish, incubated with BODIPY-cholesterol, then incubated with IFNγ-A488. Cells were washed and then imaged. Images are representative of 3 independent experiments. (K) IFNγR KO B16 cells were incubated with IFNγ-A488, then washed and stained with cell mask orange and Hoechst. Images are representative of 3 independent experiments. In membrane close-up, arrows denote IFNγ associated with the plasma membrane, o symbols denote intracellular, membrane-adjacent IFNγ, and * symbols denote intracellular IFNγ.

