Figure 1.
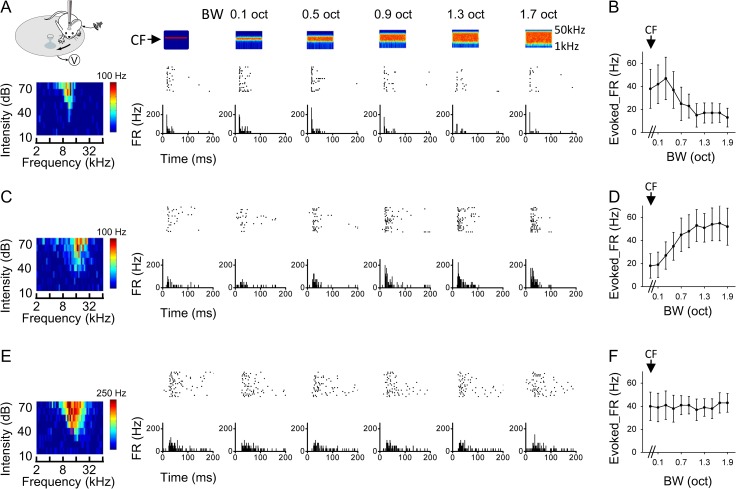
Three types of bandwidth tuning in awake mouse A1. (A) An example, type-one neuron. Left most, illustration of awake recording setup and color map for the tonal receptive field (characteristic frequency is 10.56 kHz). Top, color graphs depict time-dependent spectrograms for the applied band-passed noise (BPN) sounds (100-ms duration), with the bandwidth marked on top. Arrow points to the center frequency (CF, 10.56 kHz for the cell). Middle, raster plot of spike responses (20 trials) to the corresponding stimulus. Bottom, post-stimulus spike time histogram (PSTH) for each testing bandwidth. FR, firing rate. (B) Average evoked firing rate (FR) at each bandwidth for the same cell as shown in (A). Bar = SD. The first data point represents the response to the center frequency alone. (C, D) An example, type-two neuron (CF = 14.93 kHz). Data are displayed in the same manner as in (A, B). (E, F) An example, type-three neuron (CF = 16.00 kHz).

