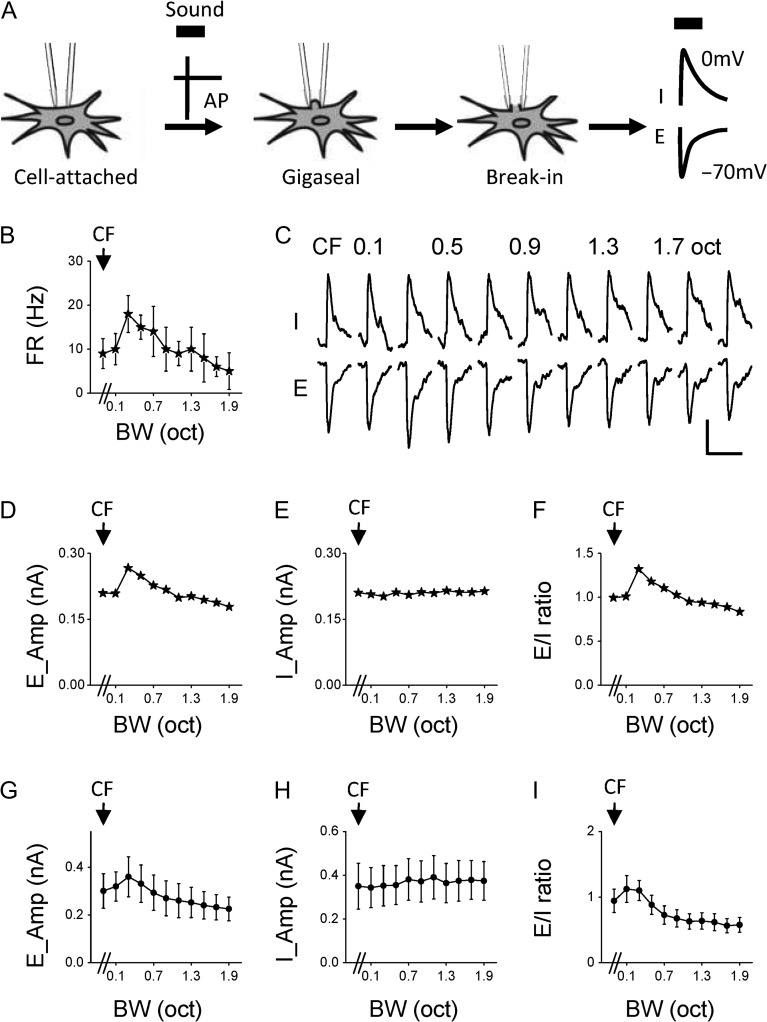
Figure 3.
Synaptic mechanisms for bandwidth selectivity. (A) Schematic illustration of sequential cell-attached and whole-cell voltage-clamp recordings from the same neuron. Thick black bar marks sound presentation. AP, action potential; E, excitation; I, inhibition. (B) Firing rates of an example nonmonotonic cell in response to BPN of different bandwidths. (C) Average excitatory (E) and inhibitory (I) synaptic currents of the same cell in response to BPN of different bandwidths. Scale: 100 pA, 100 ms. (D) Peak amplitudes of excitation at different bandwidths plotted for the same cell. (E) Peak amplitudes of inhibition for the same cell. (F) Bandwidth tuning of E/I ratio for the same cell. (G) Average peak amplitudes of excitation at different bandwidths for the group of nonmonotonic cells (n = 9). Bar = SD. (H) Average peak amplitudes of inhibition for the same group. (I) Average E/I ratios for the same group.

