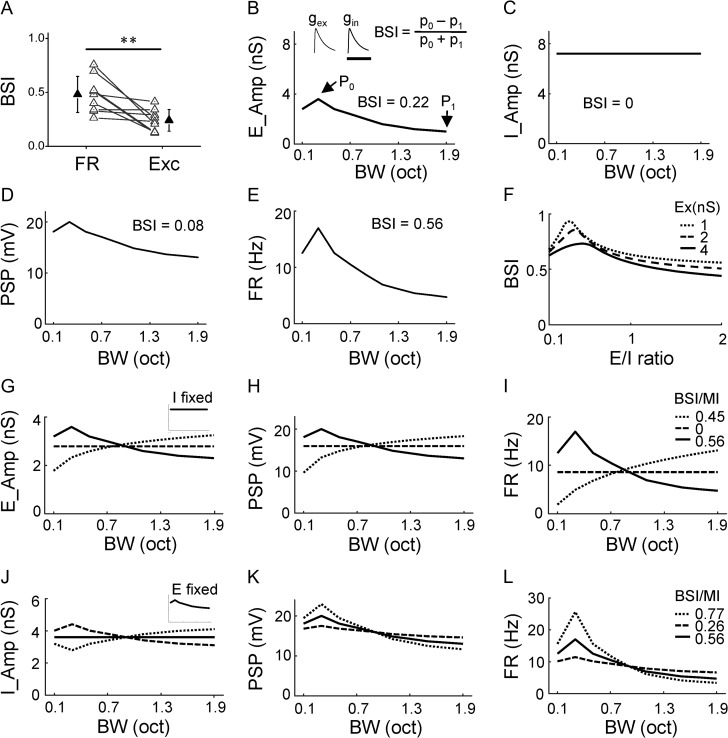
Figure 5.
Impacts of different tuning shapes of synaptic inputs. (A) Comparison of BSI between spike response (FR) and excitatory input (Exc) of the same cell. Data points for the same cell are connected with a line. ***P < 0.001, paired t-test, n = 9. (B) Tuning curve for the simulated excitation. P0 points to the maximum response. P1 points to the response at the broadest bandwidth. The BSI value is marked. Top inset, temporal profiles of simulated synaptic excitation (gex), inhibition (gin) evoked by a stimulus. Scale: 100 ms. (C) Tuning curve for the simulated inhibition. (D) Tuning of peak PSP response resulting from integrating the excitation and inhibition shown in (B, C). (E) Tuning of firing rate derived from PSP using a power-law algorithm. (F) Dependence of BSI on the absolute amplitude of excitation (represented by different types of lines) and E/I ratio (as measured at P0). (G–I) Varying the tuning shape of excitation while fixing the tuning of inhibition (inset), and derived tuning of resulting PSP response (H) and tuning of resulting firing rate response (I). Corresponding BSI (or MI) values are marked. (J–L) Varying the tuning shape of inhibition while fixing the tuning of excitation (inset), and derived tuning of resulting PSP response (K) and tuning of resulting firing rate response (L).

