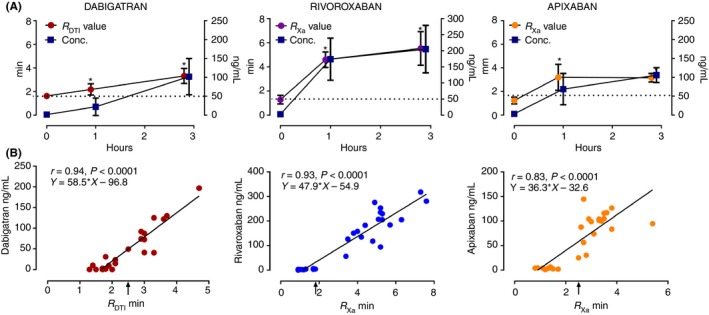
Figure 1.

(A) The DOAC concentrations and the effect on TEG 6s R. *Indicates P < 0.05 compared to baseline level at time 0. The bars represent mean ± SD. (B) The scatter diagram of DOAC concentrations against R. The dotted line represents the 50 ng/mL threshold of the DOAC concentrations. The arrow represents the R value above which the subject is considered to have DOAC concentrations at or above 50 ng/mL for the 3 DOACs examined. RDTI indicates using the DTI channel; RX a indicates using the AFXa channel
