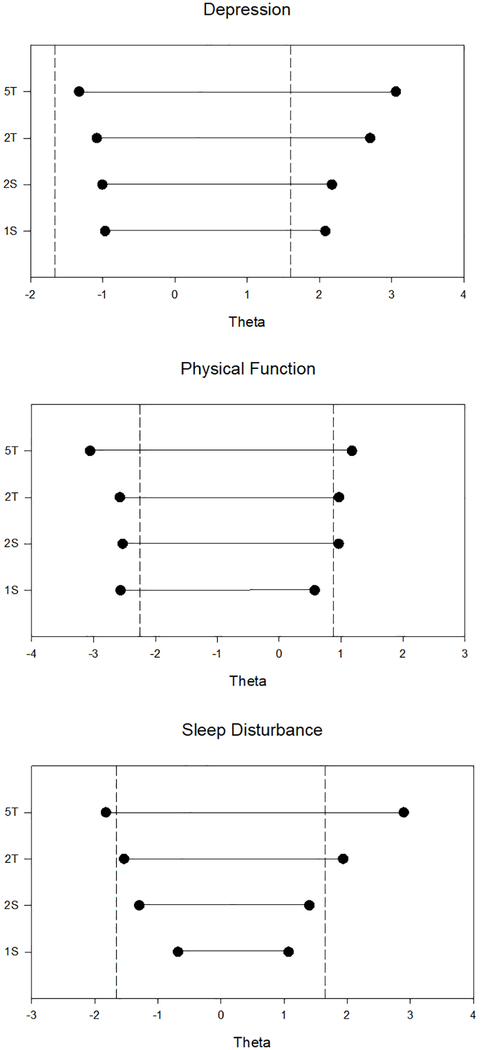
Figure 1:
Range of item bank theta scores captured by each method. IS is a single item, 2S is two items presented separately, 2T is two items presented together, and 5T is five items presented together.
Vertical dashed lines represent the area of theta that captures 90% of the item bank calibration sample.

