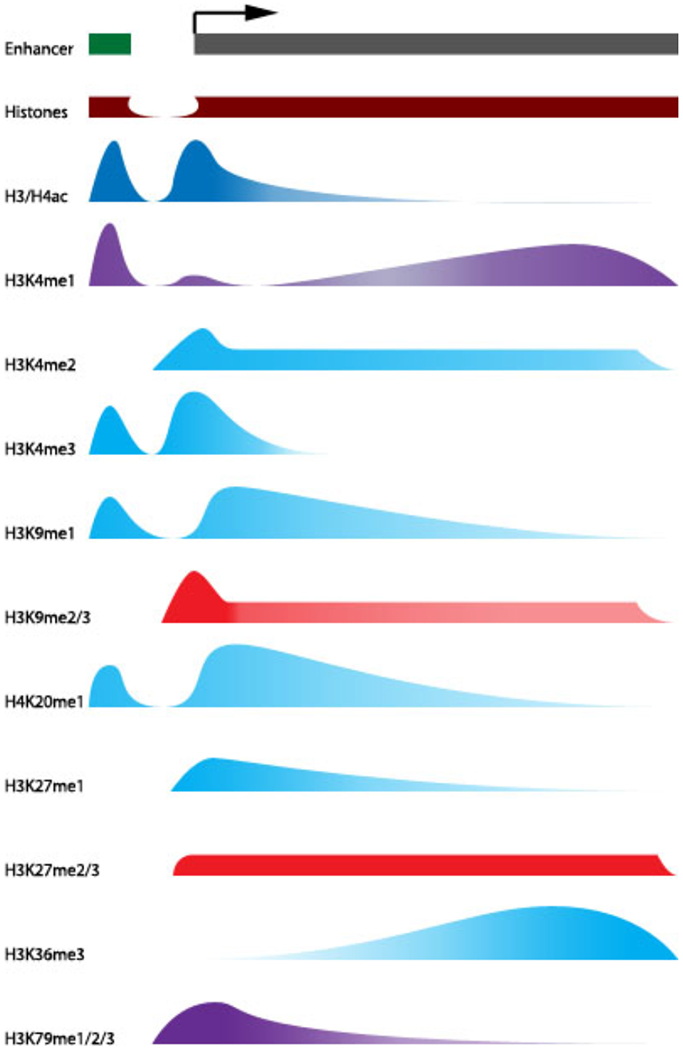
Figure 1.2.

Localization of histone modifications across genes as it relates to transcriptional regulation
Patterns of histone modification enrichment are shown across an arbitrary enhancer and gene. The enhancer is shown as the smaller region succeeded by a gap denoting a nucleosome-free region and transcriptional start site as shown by the arrow. Data used to compile the profiles are from GWAS on histone modifications. The correlative effects of the modifications on gene expression are indicated by the labels: (+) expression, (−) repression, and (+/−) studies show enrichment in both expression and repressed genes. (Wang et al. 2008; Barski et al. 2007; Li et al. 2007)
