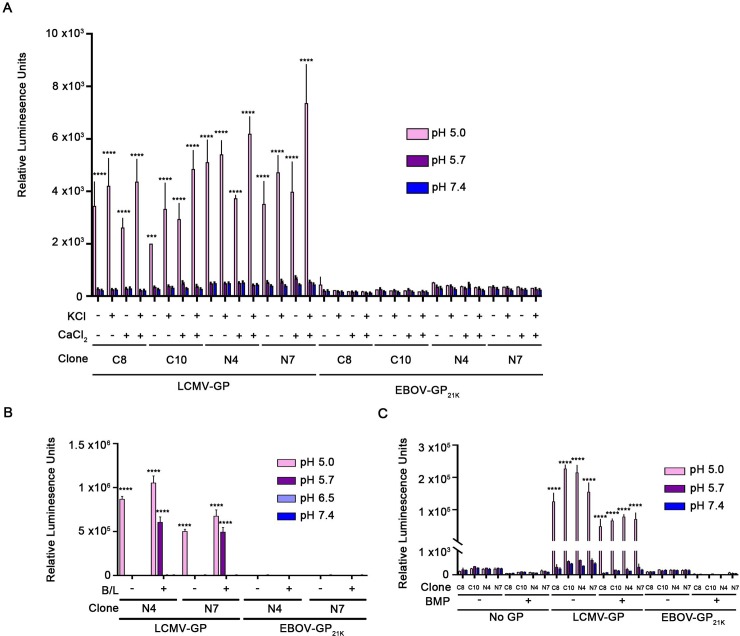
Fig 6. Addition of cations (Ca++, K+), cathepsins (B and L) or an anionic lipid (BMP) to stable clones expressing full length NPC1 at the cell surface does not promote detectable EBOV-GPcl-mediated cell-cell fusion.
Effector cells expressing the indicated GP and target control or NPC1-expressing cells were prepared as described in the legend to Fig 5B. Cocultured cells were then treated with (A) Ca++ or K+, (B) cathepsins or (C) BMP as described in the legend to Fig 3A, 3B and 3C, respectively, except that for Fig 6C, the target cells were treated with an additional mixture of 5 μM BMP and 5 μM delipidated BSA for 5 min at 10°C before being cocultured with effector cells. For Fig 6C, after coculturing for 45 min, the cells were processed and analyzed for CCF as in Fig 3C. Results represent mean +/- SD of triplicate samples from one of two experiments with similar results. Statistical analyses are based on two-way ANOVA tests: for A and B each sample was compared to the pH 7.4 sample in each group and for C compared to the respective No GP sample. ****p < 0.0001; ***p< 0.001; **p < 0.01; *p<0.05.

