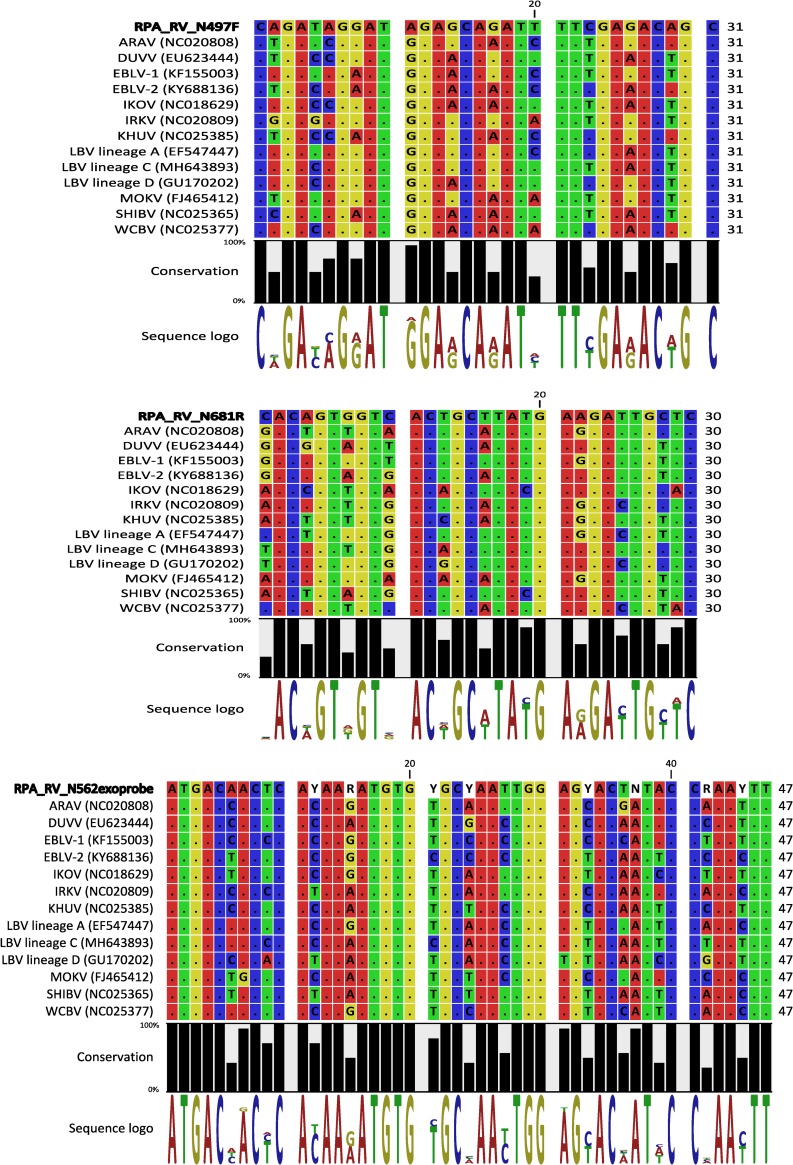
Fig 3. Binding regions of the RT-RPA primers and probe to rabies-related viruses.
Dots represent identity to the sequence in the first row i.e. RT-RPA forward primer (RPA_RV_N497F), reverse complement of the reverse primer (RPA_RV_N681R) and the probe (RPA_RV_N562exoprobe). The conservation percentage and the sequence logo created using CLC Genomic Workbench software version 6 (Qiagen) is displayed beneath the alignment. The conservation graph shows the conservation percentage of all sequence positions, the height of the bars shows how conserved that particular position is in the alignment. The sequence logo displays the information content of all positions in the alignment as nucleotides stacked on top of each other. The height of the individual letters represents the sequence information content in that particular position of the alignment.

