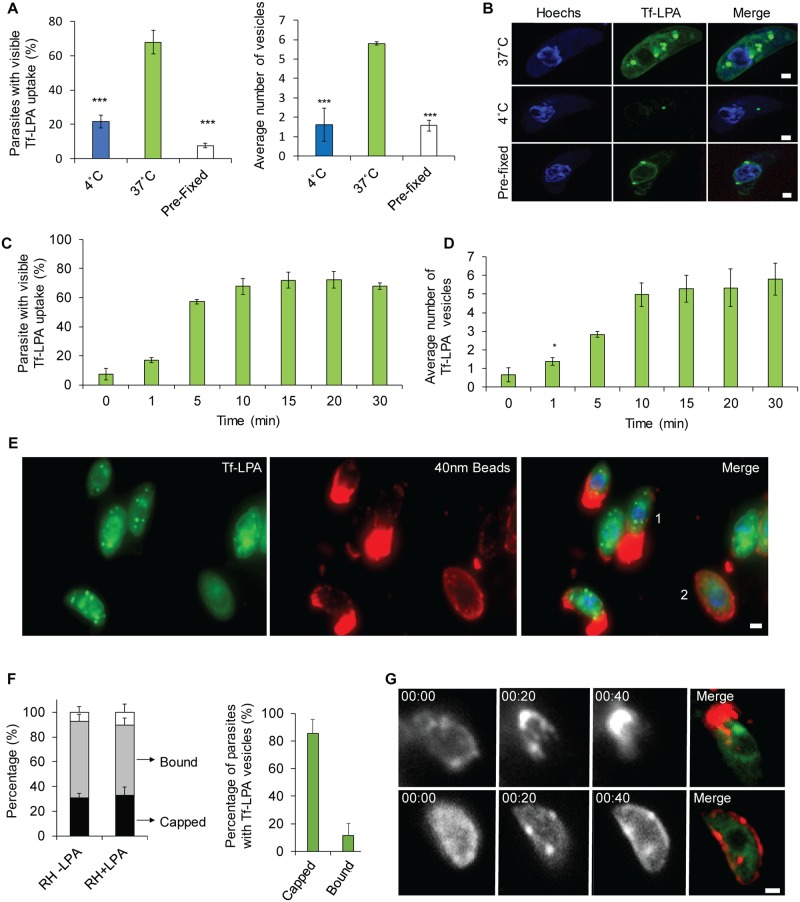
Fig 2. A link between retrograde flow and phospholipid uptake.
(A-B) Uptake of phospholipids: Tf-LPA was analysed at 37 °C and 4 °C. Pre-fixed parasites with PFA were also incubated with Tf-LPA at 37 °C. Incubation at 37 °C demonstrates a strong uptake with vesicle formation. Uptake is inhibited at 4 °C or when the parasites were fixed prior to incubation. (A) Left panel: percentage of Tf-LPA–positive parasites in each of the tested conditions. Right panel: average number of Tf-LPA–positive vesicles per parasite in each of the tested conditions. Mean values of three independent assays are shown ± SD. ***p < 0.001 obtained in a two-tailed Student t test when comparing Tf-LPA at 37 °C versus 4 °C and live parasites plus Tf-LPA versus fixed parasites plus Tf-LPA at 37 °C. (B) Example images obtained for the quantification as shown in (A). Scale bar, 1 μm. (C-D) Dynamics of uptake were analysed in a time point assay from 0 to 30 minutes after addition of Tf-LPA. (C) Average number of parasites that show overall uptake and (D) average number of vesicles per positive parasite were determined. Mean values of three independent assays are shown ± SD. (E-G) Association of retrograde flow and endocytosis was analysing by adding Tf-LPA during the bead translocation experiment. (E) Representative picture of capping and Tf-LPA uptake. An example of each phenotype can be observed: capped (1); bound (2). Scale bar, 1 μm. (F): Left panel: quantification of the percentage of capped and bound parasites that also took up Tf-LPA; right panel: percentage of capped or bound beads only in parasites showing Tf-LPA uptake. Most parasites that translocated beads also endocytosed Tf-LPA. Mean values of three independent assays are shown ± SD. (G): Time-lapse analysis of bead translocation in the presence of Tf-LPA. Examples of a parasite in which translocation occurred (top) and did not occur (bottom) are shown. Scale bar, 1 μm. For each bar graph, the corresponding data can be found in S1 Data. PFA, paraformaldehyde; Tf-LPA, Top-Fluor lysophosphatidic acid.

