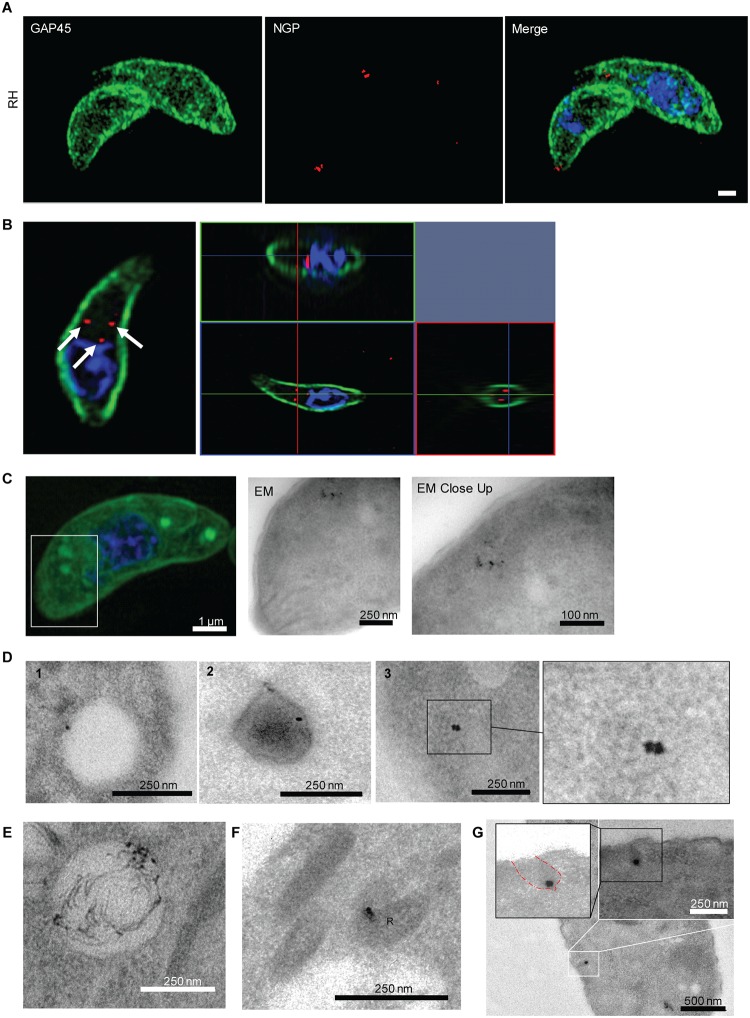
Fig 5. NGPs are taken up by T. gondii.
(A-B) Uptake of NGPs was tested on RH- and RH Tf-LPA–treated parasites with 10-μm Cy5 conjugated gold beads. Parasites were imaged using 3D-SIM microscopy. NGPs were found to accumulate below GAP45, as illustrated by either maximum intensity projection (A) or ortho-view (B). Scale bar, 1 μm. (C) CLEM imaging of Tf-LPA and NGP uptake. After the uptake experiment, parasites were imaged using super-resolution microscopy (scale bar, 1 μm) before imaging by EM to evaluate if NGPs and Tf-LPA are inside the same vesicles. White square: close-up illustrated by the first TEM image; black square, TEM close-up. (D-G) TEM localisation of NGP. Scale bar size is indicated on the images. (D) Representative images of the different types of vesicles observed: (1) large translucent vesicles (300–500 nm), (2) medium-sized dense vesicles (215–375 nm), and (3) small vesicles (80–200 nm). (E) Localisation of the NGPs in the VAC, (F) localisation of the NGPs in rhoptry bulbs (labelled with R) by TEM. (G) Image of a potential entry point as an invagination of the plasma membrane containing NGP. CLEM, correlative light and electron microscopy; EM, electron microscopy; NGP, nanogold particle; TEM, transmission electron microscopy; Tf-LPA, Top-Fluor lysophosphatidic acid; VAC, vacuolar-like compartment; 3D-SIM, three-dimensional structure illumination microscopy.

